EXECUTIVE SUMMARY
Cities, states, and metropolitan areas across the United States are looking to invest in a range of public transit projects in order to connect people to jobs and economic opportunity, reduce greenhouse gas emissions from vehicles, and shape development patterns.
According to one estimate, the United States invested about $50 billion in new transit projects in just the last decade.
These include underground subways in Los Angeles, commuter rail lines along the Front Range near Denver, a streetcar in downtown Atlanta, light rail lines in suburban Phoenix, and bus rapid transit in Richmond, Virginia, among many others.
While these projects are as diverse as the country itself, they all have one thing in common: increased scrutiny over their costs and timelines to build. A few very visible projects have reinforced the narrative that rail transit investments have systemic issues that are endemic to the United States.
This all begs the questions:
Is this true? If so, why? And what should we do about it?
These are precisely the questions Eno set out to answer through this research, policy, and communications project to analyze current and historical trends in public transit project delivery. We convened a set of advisors and conducted in-depth interviews with key stakeholders to understand the drivers behind mass transit construction, cost, and delivery in the United States. A comprehensive database of rail transit projects was created and curated to compare costs and timelines among U.S. cities and peer metropolitan areas in Western Europe and Canada. Through this quantitative and qualitative approach, we developed actionable recommendations for policy changes at all levels of government as well as best practices for the public and private sectors.
UNDERSTANDING COSTS AND TIMELINES
Eno’s Construction Cost Database of 180 domestic and international public transit projects completed since 2000 shows that the United States pays a premium of nearly 50 percent on a per-mile basis to build transit for both primarily at-grade and primarily tunneled projects. The tunneling premium in the United States rises to roughly 250 percent when New York City’s disproportionately expensive projects are included.
Tunneled projects are not only less expensive abroad, but also more common. Just under 12 percent of U.S. rail transit projects represented in our database were constructed primarily below ground, compared to 37 percent of non-U.S. projects. In fact, many international projects constructed below grade have similar costs to those that are at-grade in the United States. For example, Toulouse, France’s 9.3 mile Metro Line B was built entirely underground at a cost of about $176 million per mile while Houston Metro’s 3.2 mile Green Line is all at-grade and cost $223 million per mile.
Despite their lower construction costs, international projects are often more complex than similar lines in the United States. They tend to have more stations that are built closer together than U.S. projects, often run through crowded historic city centers, and usually share street space with cars and other vehicles. Rail projects in the United States tend to be routed along “paths of least resistance” such as freight rail or highway corridors, rather than dense areas where transit would make the most sense for riders or communities. Of course, this is not always the case. Seattle’s 1 Line corridor traverses well-developed urban areas and operates in a tunnel between the University of Washington and downtown. But many U.S. transit projects resemble Minneapolis’ Blue Line, whose mostly at-grade alignment along existing right-of-way was specifically intended to limit impacts on the local community and minimize the need to acquire private property.
Even with more straightforward alignments, U.S. projects with minimal tunneling still take about six months longer to construct than similar non-U.S. projects. U.S. projects that are almost all underground take nearly a year and a half longer to build than abroad. The time it takes to construct a transit project is also highly correlated with its cost, reinforcing the aphorism “time is money.”
RESEARCH METHODS
With an understanding that transit projects in the United States do suffer from high costs and take longer to complete than they do abroad, it is important to investigate the “why.” To do so, we conducted a thorough examination of existing literature and research and interviewed 117 professionals with both intimate knowledge of specific projects or regions and transit project delivery expertise generally. We also conducted detailed case studies of project delivery in four domestic regions (Los Angeles, Seattle, Denver, and Minneapolis) and four international regions (Copenhagen, Madrid, Paris, and Toronto) to help identify real-world examples of cost and timeline drivers for transit projects as well as best practices. We also compared a transit project to a highway project in Virginia to compare how regulatory processes, project delivery practices, institutional support, and governance differ across modes.
Through our literature review and case studies, one clear finding emerged: there is not one, easily identifiable reason for high costs or delivery delays. Rather, we identified a dozen drivers of transit construction costs and timelines that fall into three overlapping and interrelated categories: governance, processes, and standards. These findings form the basis of our resulting recommendations and best practices to deliver transit projects quicker and more cost-effectively.
There is not one, easily identifiable reason for high costs or delivery delays.
Rather, we identified a dozen drivers of transit construction costs and timelines that fall into three overlapping and interrelated categories:
POLICY AND PRACTICE RECOMMENDATIONS
The responsibility for cutting costs and timelines for transit projects does not rest solely on federal reforms, fixes at the agency level, or with private sector practice. Rather, the challenges are acute, complex, and multi-faceted. The solutions are, too. The recommendations below are based on that fundamental premise. Click each one to see further details.
Governance
First, we need to get the institutions, oversight, and decision-making right.
The public institutions charged with leading the delivery of transit projects need authority, staff, and good governance to move them forward.
Today in the United States, transit projects are delivered almost exclusively through existing entities. Public transit agencies are institutions that were designed as operating entities often to pick up the operation of struggling bus lines from private companies decades ago. Setting a clear structure for organizational decision-making responsibility, as well as coordination with other agencies and transportation modes, is critically important to the success of a transit project. The successful, low-cost expansion of Madrid’s metro system between 1995 and 2003 provides a clear example of how small, multi-disciplinary internal management teams can deliver projects effectively when they are empowered to address issues as they arise. In Denver, a delegated authority approach for the region’s FasTracks system expansion led to faster turnarounds on key decisions and fewer project delays.
Our research shows that independent, special purpose delivery vehicles (SPDV) are an attractive option to manage construction before handing the ownership and operation back to the public agency. States or regions need to create a temporary, independent SPDV, or modify an existing institution, with the necessary authorizations and abilities to manage and focus on the most complex of projects. Institutions responsible for project delivery need to be self-permitting, should be able to issue debt (if necessary), use eminent domain to acquire land, relocate utilities, as well as enter into contracts and agreements with public and private entities. Governing boards should be made up of funders and the relevant other stakeholders that are necessary to push the project forward. The organization should also have the ability to set salaries to attract and hire top project management talent and borrow staff from existing institutions. For its part, the FTA should encourage project sponsors to reform governance, authorizations, and other factors as part of receiving federal funds.
Project sponsors need to understand, manage, and commit to whatever project delivery method is most appropriate for the project.
Anecdotally, many experts have a preferred method for delivering projects. Some swear by traditional approaches, like design-bid-build while others prefer design-build or partnerships with private partners. Our work makes clear that no single delivery method on its own is a panacea for cost and timeline issues. Rather, agencies’ commitment to a delivery method and understanding of how to manage it is essential.
Project sponsors need to adopt a formal evaluation process to determine the appropriate procurement method on a project-by-project basis. Once a specific procurement method is selected, the project sponsor should commit to it and manage it accordingly.
Projects need to be developed smartly so contracts are not too large to be effectively managed, procurement goals are realistic, and the best value is returned for public dollars.
Anecdotally, many experts have a preferred method for delivering projects. Some swear by traditional approaches, like design-bid-build while others prefer design-build or partnerships with private partners. Our work makes clear that no single delivery method on its own is a panacea for cost and timeline issues. Rather, agencies’ commitment to a delivery method and understanding of how to manage it is essential.
Project sponsors need to adopt a formal evaluation process to determine the appropriate procurement method on a project-by-project basis. Once a specific procurement method is selected, the project sponsor should commit to it and manage it accordingly.
Agency staff need appropriate training in order to manage projects, construction staff, and consultants.
Overburdened and undertrained public agency staff have trouble coordinating environmental review and planning documents, creating discrete and clear procurement plans, writing smart and effective contracts, and ensuring adherence to contract terms during construction. These all lead to problems with litigation, change orders, and delays throughout a project. Project sponsors need to invest in better training and support for front office staff who are responsible for overseeing, monitoring, and managing projects from inclusion to operation. They should also establish small, multidisciplinary teams of high-quality, experienced executives with control over on-the-spot decisions, and enough junior staff to support them. FTA needs to work with project sponsors to more precisely determine their workforce needs for project delivery management and oversight
In addition, this research found that the unionized, frontline construction workforce is not a primary target for cost or timeline efficiencies on major projects domestically or abroad. Project sponsors should, however, establish equitable project labor agreements (PLAs) as a valuable way to avoid worker strife by providing clear arrangements for dispute resolution, pre-approved compensation, and work rules. Labor leaders should be at the table at the beginning of project development in order to address potential concerns early on, create flexibility in work rules and overtime, as well as establish a shared understanding about conflict resolution and scheduling to keep projects moving efficiently and safely.
Processes
Second, some of the processes, procedures, and practices that public and private actors must undertake in order to build transit projects—from conception to final completion— are often too slow, cumbersome, or outdated. We need to make it easier to build more and better transit projects.
The federal NEPA statute does not need to be reformed, but the processes by which federal agencies reach a record of decision does.
NEPA is an important part of making sure that projects are transparent about their potential impacts to the built and natural environment, the air, and the communities affected. It is one of the few mandated opportunities for historically underrepresented communities to provide input into projects. It is also, however, subject to an uncoordinated, duplicative, and convoluted process. Although environmental rules, regulations, and requirements in other countries are as just as elaborate, the environmental review processes are generally better streamlined, and approval is obtained faster than in the United States. Many of the challenges with NEPA are attributed to misunderstandings and conflicts between agencies. Early and consistent coordination between agencies during planning and environmental assessment would undoubtedly help foster agreement on issues and avoid delays. Sharing of best practices in environmental assessment between agencies and project sponsors would further help improve common challenges in reaching a record of decision.
The Council on Environmental Quality (CEQ), an entity within the Executive Office of the President, should require more regular face-to-face meetings of federal agency field staff involved with preparing environmental documents and require sharing of environmental documents between permitting agencies to cut down on duplicative tasks. The Biden Administration should issue an executive order focusing on better coordination and consolidation of the disparate timelines and processes among the various regulations that fall under the umbrella of NEPA. Once issued, the FTA should execute an agreement with relevant federal agencies such as the Army Corps of Engineers and commit to working together in a more frequent, collaborative manner. CEQ should also set up an annual environmental permitting conference to build expertise and allow for exchange of best practices among stakeholders.
To go a step further, the United States can look to Madrid and Ontario, whose respective governments have set up specialized environmental reviews for transit projects. Given the net-positive environmental benefits of transit, Congress should create a pilot program to allow the federal transportation secretary to exempt select public transportation projects from NEPA if sponsors are able to demonstrate that they conducted robust community engagement and evaluation of project alternatives through the planning process. FTA should monitor this pilot program to measure its effectiveness at saving time as well as ensuring environmental protection.
States and project sponsors also need to invest in the staff and processes for their own permitting and environmental review.
Highway projects interact with the environmental review process more regularly given how routinely the United States builds roadway projects. To lean on their deep expertise, transit project sponsors should borrow staff from state departments of transportation (DOTs) and the federal highway administration (FHWA) to assist with preparing environmental documents. Transit project sponsors should take advantage of revised federal regulations to no longer require the evaluation of “all reasonable alternatives” and instead examine only those alternatives deemed feasible. Congress should also dedicate more resources to the FTA to increase staffing in their regional offices and help assist transit agencies with preparing and coordinating environmental documents.
But since state laws and regulations are often as complicated and suffer from the same siloed nature as federal permits, states should set up their own entities similar to the Federal Permitting Improvement Steering Council. If structured correctly, they would help local agencies navigate state environmental regulations and coordinate between various state and federal staff.
The planning and community stakeholder engagement process needs greater investment and more attention.
Despite their efforts, project sponsors generally invest too little in early planning and public outreach, and still employ outdated tools. Project sponsors need to dedicate more staff and resources to working directly with communities and secure scope agreements as early as possible during the project planning stage to prevent disagreements and issues from causing delays and issues further into a project. In doing so, sponsors should employ non-traditional forms of public engagement including opportunities to provide virtual feedback, having smaller meetings in individual communities (rather than the traditionally large, informal public meetings held in an auditorium), and hosting meetings at non-traditional hours.
Project sponsors should work with the community to recognize trade-offs and push for greater short-term disruption to advance construction faster. Agency staff also need to be more empowered to make tough decisions on project scope and requests through a transparent process, with public sector planners documenting all comments to demonstrate how they inform an agency’s final decisions. Staff should take care to respond to every comment, document why certain options regarding project scope were advanced or taken off the table, and show how decisions were made with public input and social equity top of mind.
Policy and practice reforms are needed to address significant shortcomings related to utility relocation and land acquisition.
Utility relocation is among the most complex elements of a transit project and is frequently cited as a major cost and timeline driver. Old and inaccurate maps complicate efforts to identify utilities and lead to additional costs and delays to address unexpected site conditions. As a result, project sponsors need to dedicate enough staff with expertise in utility relocation. These staff should be brought on early in the planning phase and remain through the duration of construction. Project sponsors and utilities should sign agreements early in the project development process and relocate or identify as many utilities as practical prior to construction. Early utility identification and relocation yields significant cost and timeline savings throughout the course of a project’s construction. On the other hand, misidentification of utilities can lead to significant costs due to change orders and unexpected findings during construction.
Similar challenges exist with the land acquisition process, which can be lengthy and involve confrontations or disputes with communities along a project’s alignment. Early and prompt land acquisition can result in significant time and cost savings for projects. Since highway departments conduct land acquisition and utility relocation on a much more regular basis, transit project sponsors should work with staff at state DOTs to borrow staff experienced in utility relocation and land acquisition.
Standards
Third, building more and better transit demands a new framework for how we think about projects, the standards that are applied, and the policy environment in which they operate.
Customization should be deemphasized in favor of updated standardization to save on construction costs and speed up delivery.
Undeniably, transit investments—especially stations—help shape communities, neighborhoods, and define a community’s character. But this research found an overemphasis among U.S. decisionmakers to customize stations and vehicles when designs could be simplified and streamlined by standardizing components. The Copenhagen Metro, for example, used standardized station designs, equipment, materials, components, and off-the-shelf rail cars to minimize costs and allow for easy repairs. U.S. project sponsors, particularly those constructing new systems, should adopt vehicle and station designs from peer agencies to simplify design and trim costs.
Further, the longstanding U.S. approach to safety and other project standards should be revisited. Project sponsors, FTA, and transit constituency organizations should review existing construction standards to see if they can be more performance-based and useful in ways that can maintain safety but open avenues for more creative ways to meet them. To help inform such a review, the FTA and project sponsors should establish dedicated programs to exchange best practices on project delivery and station design, including but not limited to regular study tours. This involves looking at other countries beyond Western Europe, too, where great examples abound.
Transit projects in the United States need to maximize their public benefits.
When faced with escalating costs and community resistance, project sponsors in the United States often select routes that are significantly less expensive, do not interface with communities, nor require the intensive utility relocation often necessary for at-grade options along boulevards or other urban roadways. Project sponsors should weigh the tradeoffs between cost, complexity, and ridership when considering alignments. In doing so, project sponsors should enact a policy that clearly outlines when and how stakeholders can request project enhancement (“betterments”), include a process to evaluate whether to grant the request, and require the requesting entity to cover the cost in most circumstances. Community benefit agreements should be used to address community concerns and are useful when conducted early in the process.
Federal incentives are another powerful tool to enable project sponsors to increase the overall standards of their transit projects. For example, the federal Capital Investment Grants program needs to require minimum zoning densities or level of development around stations as a condition for federal funding. Similarly, federal evaluation needs to de-emphasize ridership as a key component of a project’s success and rely on accessibility metrics more often.
CONCLUSION
During this time of economic uncertainty, environmental concerns, and social anxiety, it is critically important we get the most out of our existing public investments. The dramatic changes foisted upon the nation as the result of the COVID-19 pandemic highlighted the importance of public transit for essential workers, low-income riders, and neighborhood connectivity. While the federal government literally came to the rescue with emergency funding to keep most of these systems afloat, there is appropriate scrutiny now to make sure the projects we do undertake are successful both during the planning, construction, and implementation phases.
Our national goals around economic growth and opportunity, climate change, and social equity all mean we are going to need more and better transit than we have today. But we are not going to get more or better transit if we cannot figure out how to deliver projects in a timely and cost-effective way. As we consider transit investments in a new post-pandemic light, it is critically important our investments are as efficient as possible.
Table of Contents
INTRODUCTION
The desire to build infrastructure projects faster and cheaper has persisted since the earliest infrastructure projects were completed. Famous projects like the Hoover Dam, the Golden Gate Bridge, and the Empire State Building are celebrated for the speed in which they were completed, and the transcontinental railroad was literally a race to see which company could lay track the fastest.
Of course, those historic projects were all designed, built, financed, and governed under different circumstances and very different regulatory environments. The rules, procedures, and preferences that exist today at all levels of government are intended specifically to avoid the horrific way workers, the environment, and neighboring residents were impacted by infrastructure projects in the past, and to ensure that safety remains paramount for users. While those rules and regulations have certainly helped to achieve those goals, infrastructure projects have become so costly and take so long to build that few large projects are being built, especially for public transit. This is particularly disheartening when we examine other countries in Europe, Asia, and elsewhere that have similar standards but much lower costs.
But why? What can we learn from previous research and practice to understand how transit projects are delivered, the primary cost drivers, and impediments for their timely delivery?
This report answers these questions albeit with important caveats. For one, there is significant attention given to individual projects that take much longer than expected or experience cost overruns. We address those problems to a limited extent but are primarily interested in whether and why transit projects cost more and take long to deliver than international peers in the first place. As a result, this report focuses on overall project timelines and costs. Much of the existing work on cost and timeline drivers tends to be narrowly focused either on cost overruns, or on specific elements of project delivery. Recently completed subway projects in New York City, which are among the most expensive ever built, also receive a substantial amount of coverage given the outsized role public transit plays in that region. Other case studies often focus on a single transit line, region, or country, resulting in conclusions that are relevant to a particular area or specific project, but might not be broadly transferable. In addition, research conclusions on certain subjects—like delivery models— occasionally conflict.
This research and resulting policy recommendations aim to shift the current national conversation around transit project delivery from simply diagnosing problems to identifying and implementing opportunities to deliver better and more cost-effective projects. This report raises the level of discourse around project delivery by relying on comprehensive qualitative and quantitative findings, as opposed to idiosyncratic and isolated anecdotes. Lastly, the work directly informs federal decision-makers as they pursue reform-minded policies, as well as helps state and local actors more effectively invest in transit networks to grow local their economies, reduce greenhouse gas emissions, and connect people to opportunity.
METHODOLOGY
To fully explore how projects are delivered, understand where the challenges occur, and develop solutions to overcome those challenges, this research employed an approach that had four distinct components, illustrated in Figure 1 (click to see an expanded image of the process).
FIGURE 1: TRANSIT COST AND DELIVERY METHODOLOGY

The first step was to better understand the problem and where it was most acute. To do this, the Eno team created a construction cost database of 180 domestic and international rail transit projects completed over the past 20 years. The database is limited to examples in the United States, Canada, and Europe. The research team kept the geographical range to these countries and regions because of their comparable political culture, government structures, and infrastructure development and age.2 For each project, factors such as number of stations, grade alignment, station spacing, and mode, adjusted for purchasing power parity and inflation, allow for comparisons.
The database helps draw conclusions about the extent to which transit construction costs differ in the United States and peer countries, as well as sheds light on the differences between project characteristics and complexity across countries. The database informs the analysis in Section 3 and is also available for download to other researchers investigating similar topics.
A range of academic, media, industry, and government resources were used to obtain reported construction costs for all new lines entered into the database. It draws from official cost reports wherever possible, either from agencies or other entities directly responsible for construction. When using media reports, we aimed to confirm whether the same—or very similar—cost figure was used across other outlets. Additional project detail collected includes the year and month of groundbreaking and opening for service to the public, project length (kilometers and miles), number of stations, grade alignment (i.e. the share of total alignment that is below ground, at-grade, and above-ground), and station spacing (calculated as average miles between stations). The database also uses inputs from construction cost data collection from the Federal Transit Administration’s Capital Cost Database and by researchers Alon Levy and Eric Goldwyn at the NYU Marron Institute and Yonah Freemark via The Transport Politic.3
With the data showing a clear cost and timeline premium in the U.S., the next step was to better understand why. The research includes a thorough background assessment of existing documentation and previous research related to project delivery to understand key cost drivers and how they influence project outcomes. We evaluated reports, data, project-specific documents, and presentations from academic, research, and government sources. The documentation on project delivery we assessed spanned all phases from the preliminary idea and design phases through construction.
This report classifies cost and timeline drivers into three broad, interrelated categories with 11 specific topic areas, detailed in Section 4:
Governance
The public authorities that oversee transit project funding and construction in our federalist system. Includes how they function, the way they make decisions, and how they work with other public authorities and with the private sector.
Standards
The federal, state, and local rules and regulations that must be adhered to in order to achieve an overall policy goal directly or indirectly related to the project.
Processes
The procedures and practices that public and private staff undertake to build transit projects from conception to final completion. Includes the steps that must be followed, timelines, and tasks to be completed.
To fully understand how public transit projects are delivered, this report includes detailed case studies of nine regions in the United States, Canada, and Europe. These studies not only yield facts and details of the specific projects within those regions, but also uncover elements that may not otherwise be captured in the data, literature, or popular reporting. While each region is uniquely different, there are clear commonalities in project delivery across regions that determine cost and timeline drivers, and impact project outcomes. This report includes the following case study regions, detailed in Section 5:
- Domestic: Denver, Los Angeles, Minneapolis, Seattle
- International: Copenhagen, Paris, Madrid, Toronto
- Highway case: I-495 HOT Lanes in Virginia
The case studies also help determine whether projects in the United States are being built to higher technical and safety standards than elsewhere, and to what extent factors like governance, institutional experience and staff capacity, project management, and contracting practices influence project outcomes. By identifying specific drivers as well as best practices in project delivery, the case studies inform the policy and practice recommendations in Section 6.
For this research, a case study is defined as a project or several projects delivered by an agency or agencies in a region, opened to the public between 2000 and 2020.5 This timeframe ensures that a project has a clear final cost and is also recent enough in interviewees’ memories that they can recall important details. For each of these cases, the lead agency in each region has completed at least two projects in the past 20 years. This allowed the research team to learn from an agency’s experience delivering multiple projects in a single region. Since this work is intended to inform transit project delivery in the United States, the international cases are limited to regions with comparable development patterns, economies, and governmental and legal structures.
The final cases also highlight comparable transit modes to what is typically constructed in the United States, specifically light rail. In particular, Paris and Madrid invested heavily in their regional tram systems, which provides direct comparisons to U.S. light rail projects. Domestic cases avoid outliers such as extremely expensive projects (like in New York City) that are unlikely to provide comparable lessons for other regions in the United States.6
A key part of the case study research was conducting interviews with stakeholders and experts in regions. The not-for-attribution interviews were not limited to organizations building rail transit, but also included other groups that have direct and indirect input to the governance, planning, and execution of capital projects. Specifically, interviewees included senior level representatives from the following types of organizations:
- Transit operators
- Transit oversight agencies, where applicable
- Metropolitan planning organizations (MPOs)
- City governments, including planning departments and officials in select cities
- State government, including officials from state departments of transportation
- The Federal Transit Administration and regional offices
- Academics with specialized knowledge in transportation and an understanding of the region
- Advocacy organizations and think-tanks, including riders’ unions, business groups, chambers of commerce, and other nonprofits
- Labor unions
- Former transit and government officials with specialized knowledge in transportation and an understanding of the region
The findings included in this report are almost entirely based on consistent information from multiple sources and interviewees.
As part of this project, the Eno team interviewed 117 individuals at 72 organizations.
While this methodology generated a set of findings that is inherently subjective, it also provided a level of insight not often found in the existing literature. Much of the agency-specific detail in the background and case studies is publicly available on the agencies’ websites, unless otherwise indicated.
Woven throughout the data analysis, background research, and case studies is consistent engagement with a high level, 22-person project advisory panel, consisting of experts from academia, industry, transit agencies, as well as state, local, and federal government. Eno consulted with the advisory panel before and during each major stage of this project, including case study selection, creation and release of Eno’s construction cost database, and development of our policy recommendations. Eno also convened separate sub-panels of representatives from labor unions and major design and engineering consultancies to gain further insight into various phases of project delivery and receive input on preliminary findings.
Insights and consistent themes that emerged from the research formed the basis of the takeaways and recommendations in Section 6. The recommendations also incorporate best practices that emerged from the literature review, case studies, Advisory Panel meetings, and discussions and feedback from additional interviews with experts and practitioners in various elements of project delivery such as environmental review, permitting, engineering, and labor, among others.
ANALYSIS OF TRANSIT CONSTRUCTION COST DATA
The following analysis is designed to help set the baseline for the systemic problem in the United States with high costs and long timelines associated with delivering transit capital projects. The data shows three important findings:
When evaluating transit projects, grade alignment has a stronger impact on costs than mode.
The United States pays a premium for rail transit that gets worse as projects get more complex, particularly for tunneled lines.
The United States takes longer to complete construction of rail transit projects than international counterparts, which also drives-up costs.
Section 2 of this report details the methodology for Eno’s capital cost database, but several points are important to reiterate because they are relevant to this analysis.
First, this analysis includes projects that have been completed between 2000 and 2020. There are some exceptions made on a case-by-case basis to include projects outside this range to help provide additional context and comparisons. Similarly, the database generally does not include projects that have not yet opened for service, but the database does include a few projects in Boston, San Francisco, and others that are set to open in 2021 because of their complexity and importance in the national discussion around transit project delivery.7
To compare projects across geographies and over time, the database adjusts costs so all project costs are compared in 2019 U.S. dollars. This is done with a two-step process. First, international reported costs were adjusted using purchasing power parity (PPP) rates for projects reported in non-U.S. currency. Currency conversions were based on the OECD’s PPP table, which documents conversion rates for international currencies to U.S. dollars in a given year, taking differing price levels between countries into account (measured as foreign currency needed to purchase $1 worth of goods).8
Then, projects were adjusted to 2019 dollars for inflation using the project’s midpoint. Instead of using a standard inflation calculator based on the consumer price index (CPI), the research team decided to use the Engineering News-Record (ENR) Construction Cost Index (CCI). The CCI is a more accurate reflection of buying power for construction as opposed to the CPI, which is based primarily on consumer spending in categories like healthcare, housing, and utilities. Eno also evaluated other indices, including several producer-price indices published by the Bureau of Economic Analysis, and decided that the ENR CCI was most applicable and appropriate for transit projects.9
Comparing as-built construction costs can offer some clues as to whether other countries are building public transit systems more cost-effectively. However, there are several caveats and challenges when attempting to make a true “apples to apples” comparison between domestic and international construction costs. The final output of the database is a comparable “unit cost,” in inflation- and currency-adjusted dollars per mile of rail line.
But not all projects and agencies are transparent in their cost reporting, and when they are, the data tend to be reported inconsistently. For example, some projects include costs not associated with the actual unit cost of mile of rail line. Elements like maintenance facilities or rolling stock are included in some projects, but not others. Worse, detailed cost breakdowns are typically not reported for most projects, and if they are, there may be vast differences in the categories used. For federally funded projects in the United States, regulations require agencies report cost breakdowns using nine Standard Cost Categories (SCCs), shown in Table 1.10.
TABLE 1: FTA STANDARD COST CATEGORIES

However, as the Eno team discovered when reviewing select cost breakdowns received through Freedom of Information Act (FOIA) requests, some agencies in the United States also use their own internal methodology to track costs, especially for projects that are locally funded. Rather than reporting project costs for items like stations, sitework, and stations, costs in some cases are broken down by project phase (i.e. preliminary engineering or final design). Cost breakdown methodologies between countries can also vary. Of the 26 projects in the database that have full cost breakdowns (all U.S. projects), 22 reported vehicles as part of the total cost, and 14 reported a maintenance or support facility. Land acquisition costs were reported in all 26 of the projects, indicating that these are likely included in most U.S. projects. The database does exclude the cost of maintenance facilities and rolling stock when available.
When comparing construction costs, it is important to avoid drawing sweeping conclusions or over-interpreting trends, though such comparisons will become richer with more data. Keeping these caveats in mind, the following takeaways will inform our research and spark additional questions that in-depth case studies can answer with more accuracy.
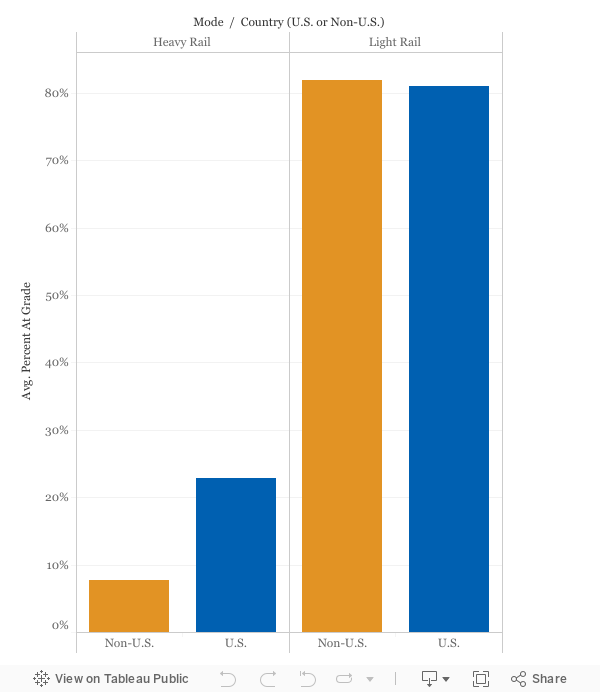
3.1 Grade alignment is much more correlated with cost than the mode of transit.
Defining “modes” of transit is a perennial debate, with inconsistencies across and within countries around the world. For the most part, the Eno capital cost database focuses on heavy rail and light rail transit projects. Most new transit infrastructure in the United States is light rail, so the database includes many international examples of light rail projects. In most cases, European trams are similar to U.S. light rail in their grade alignment (surface, tunneled, or elevated), stations, and vehicles.
The database does not include intercity rail projects (like California High Speed Rail or comparable international examples). The database also avoids U.S. streetcar projects, which rarely travel in their own right-of-way (ROW) and are often loops instead of bidirectional track, making cost comparisons difficult. Some commuter and regional rail projects were included, particularly if they involved building new infrastructure (and are thus like heavy rail). But many U.S. commuter rail projects, which primarily run from outlying suburbs to city cores, were also excluded from the database, as most of these projects were conversions of existing freight rail infrastructure for commuter rail service and include little new construction.
Defining the mode of a transit project—whether it’s light rail or heavy rail—does not correlate well with its construction cost. Most of the construction and planning inputs for both modes are the same, despite shorter trains and stations for light rail projects. A transit line, whether heavy or light, includes laying track, installing electrical systems, and building accessible stations. Therefore, when making cost comparisons, light rail is not inherently cheaper than heavy rail—it is only that light rail tends to be at-grade, while heavy rail is usually not, making the latter more expensive.
FIGURE 2: GRADE ALIGNMENT COMPARISON—U.S. AND NON-U.S.
3.2 The U.S. pays a greater premium as projects get more complex, particularly with tunnels and stations.
Figure 3 below plots project grade alignments (percent of total alignment that is at-grade) against costs-per-mile and illustrates how most U.S. rail transit projects in the database are built primarily at-grade in contrast to non-U.S. projects.
FIGURE 3: GRADE ALIGNMENT (PERCENT AT-GRADE) VS. COST-PER-MILE

Source: Eno Capital Cost Database
Note: The trendlines are not intended to represent or be interpreted as a linear regression, but rather to illustrate the general direction of construct costs as they relate to a project’s grade alignment.
Despite some successes domestically and some costly projects abroad, the United States in general pays a significant premium to tunnel, a dynamic that has also caught the attention of some trade publications.11 The database shows New York City’s Second Avenue Subway and 7 line extension cost $3.5 billion per mile and $3 billion per mile, respectively. Transit projects elsewhere in the United States are much less expensive than these two outliers. Many international projects are built primarily below-grade but have similar costs as at-grade projects in the United States.
TABLE 2: AVERAGE CONSTRUCTION COSTS PER MILE (USD)

Source: Eno Capital Cost Database
Note: Only four U.S. projects are within the 20-80 percent bucket and conclusions for that part of the dataset are limited
As Table 2 illustrates, there is a U.S. premium for both mostly at-grade and mostly below-ground projects, though the premium is higher for tunneled projects (particularly when including New York City). The tunneling premium can be seen more clearly in Figure 4 below by plotting projects’ share of below-ground alignment with their cost-per-mile, and excluding the two outlier projects in New York City.12 Not only is the cost trendline for U.S. projects steeper than for non-U.S. projects, but there is a sizeable number of fully tunneled international projects that were built at a comparable cost to at-grade U.S. projects in the $100-$300 million per mile range.13
FIGURE 4: PERCENT TUNNELED VS. COST-PER-MILE

Tunneling increases the complexity of a transit project, resulting in much more variability in costs. Figure 5 illustrates the distribution of construction costs-per-mile by the share of project alignment below ground. There is noticeable, but not dramatic, variation in construction costs for mostly above-ground projects (<20 percent tunneled) in both the United States and abroad. However, costs can vary considerably for projects that are largely below ground (>80 percent tunneled).
FIGURE 5: COST VARIABILITY BY SHARE OF ALIGNMENT IN TUNNELS
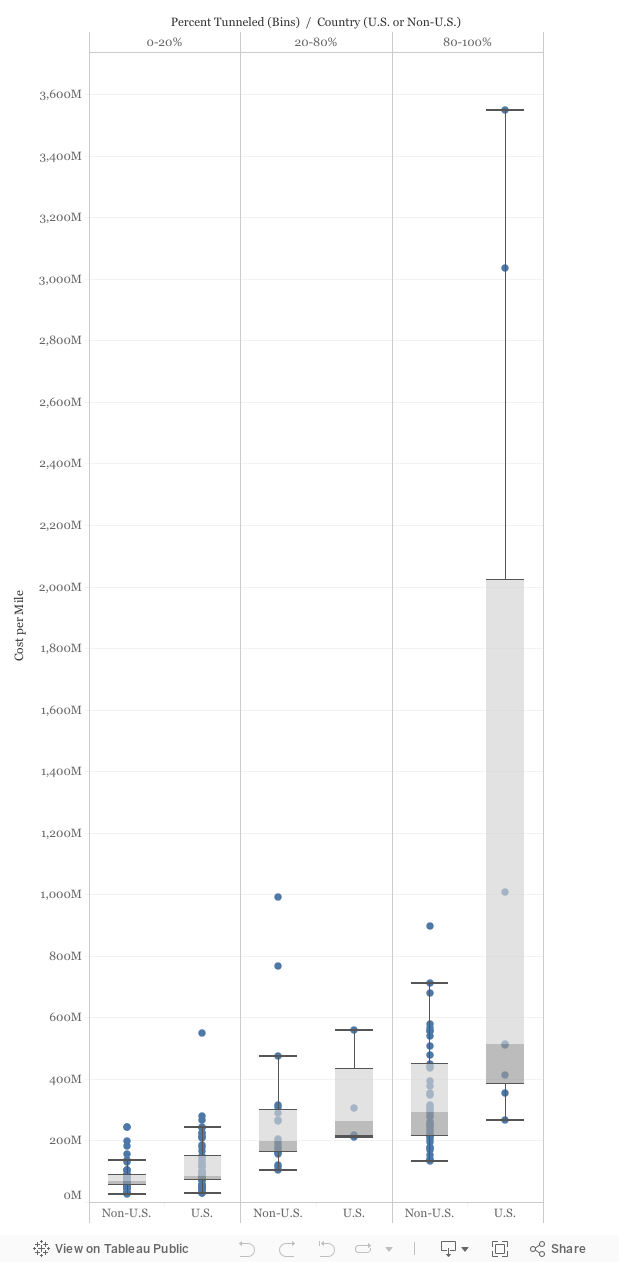
Outside of the United States, where tunneled projects are more common, below-grade lines range from as low as $135-215 million per mile for fully underground tram and metro lines in Madrid and Toulouse, to as high as $500-900 million for subway projects in Barcelona and London (and some Parisian Metro lines). Tunneled projects in the United States range from $270 million to 1 billion per mile (and up to $3.5 billion for projects in New York City, which are excluded from the plot). There are significantly fewer U.S. tunneled lines in the database compared to international projects, and the presence of two large outlier projects in New York City further contributes to the dramatic variation in U.S. costs for tunneled projects. However, Current budgets and cost estimates for tunneled lines that are not in the database but are under construction or proposed are still significantly higher than most peer projects abroad, with a notable exception in Seattle.
- Seattle Light Rail Northgate Extension (4.3 miles, 3.5 miles in tunnels): $419 million per mile14
- Los Angeles Purple Line Extension Phase 1 (3.9 miles): $1.2 billion per mile (excl. vehicles)15
- Los Angeles Purple Line Extension Phase 2 (2.6 miles): $967 million per mile (excl. vehicles)16
- Los Angeles Purple Line Extension Phase 3 (2.6 miles): $1.4 billion per mile (excl. vehicles) 17
- Los Angeles Regional Connector (2 miles): $900 million per mile (excl. vehicles)18
- Downtown Austin Light Rail Tunnel (1.5 miles): $1.3 billion per mile19
If included in the database, these projects would still fall within the higher cost-range for U.S. projects. The U.S. tunneling premium, excluding New York City, would increase from 48 percent to 123 percent, reflecting an average construction cost of $771 million per mile, compared to $511 million per mile. These projects further reinforce the relatively high cost of building below-ground transit in the United States.
Some of the cost variation for tunneled projects can be attributed to factors like geological conditions (which vary considerably in each region and can significantly influence the cost and complexity of tunnel boring), technical specifications, tunnel depth, or station design (see Section 4.10). The detailed, regional case studies in Section 5 shed light on other governance or process-related elements that can affect construction costs, including project and contractor management, institutional expertise, permitting, and regulation.
Stations can also constitute a large portion of overall transit project costs and add more complexity to the projects. For tunneled projects in the United States, the database shows stations accounting for around 25 percent of total project costs. Research shows that station depth, size, and architecture is a significant project cost driver (see Section 4.10). But despite their generally lower cost per mile, international projects have more
and closer stations on average, which is usually more common and useful in denser areas. However, the database analysis shows station spacing does not seem to have a clear correlation with cost.
The database calculates the average distance, in miles, between stations.20 A high-level comparison of station spacing across U.S. and non-U.S. project suggests in Figure 6 that transit stations are spaced closer together abroad, especially for lines mostly at-grade, which have nearly a third of the distance between stations as at-grade U.S. lines. These at-grade lines—most of which are tram or light rail projects—often run through dense, historic city centers and are usually not grade-separated.
FIGURE 6: STATION SPACING VS. COST-PER-MILE
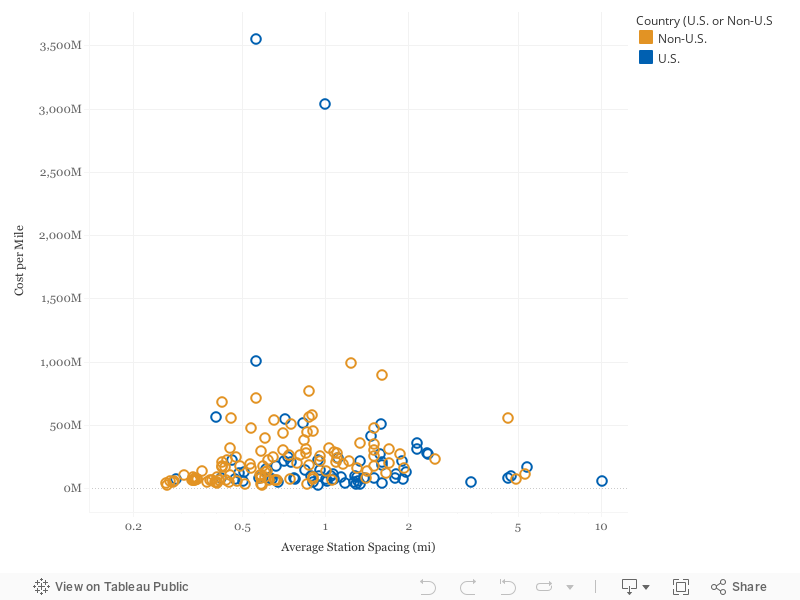
Comparing average station spacing of projects with their cost-per-mile does not indicate a relationship between station spacing and costs but suggests that European transit projects have higher station densities without a significant cost premium. This comparison, however, may not fully capture differences in technical complexity between U.S. and non-U.S. projects, particularly considering that some international tram lines might have more in common with mixed-traffic streetcars compared to fully grade-separated light rail in the United States.
3.3 Projects outside of the U.S. take longer to build, mostly because they are far more complex.
In addition to project costs, this database also includes information on project timelines—measured as groundbreaking and opening months and years. On average, non-U.S. projects in this database take slightly longer to build than U.S. projects (5 years abroad compared to 4.7 years in the United States).21 However, there are considerable differences in the time it takes to complete projects based on their grade alignment.
FIGURE 7: PERCENT TUNNELED VS. TIME TO COMPLETE (IN MONTHS), U.S VS NON-U.S. PROJECTS
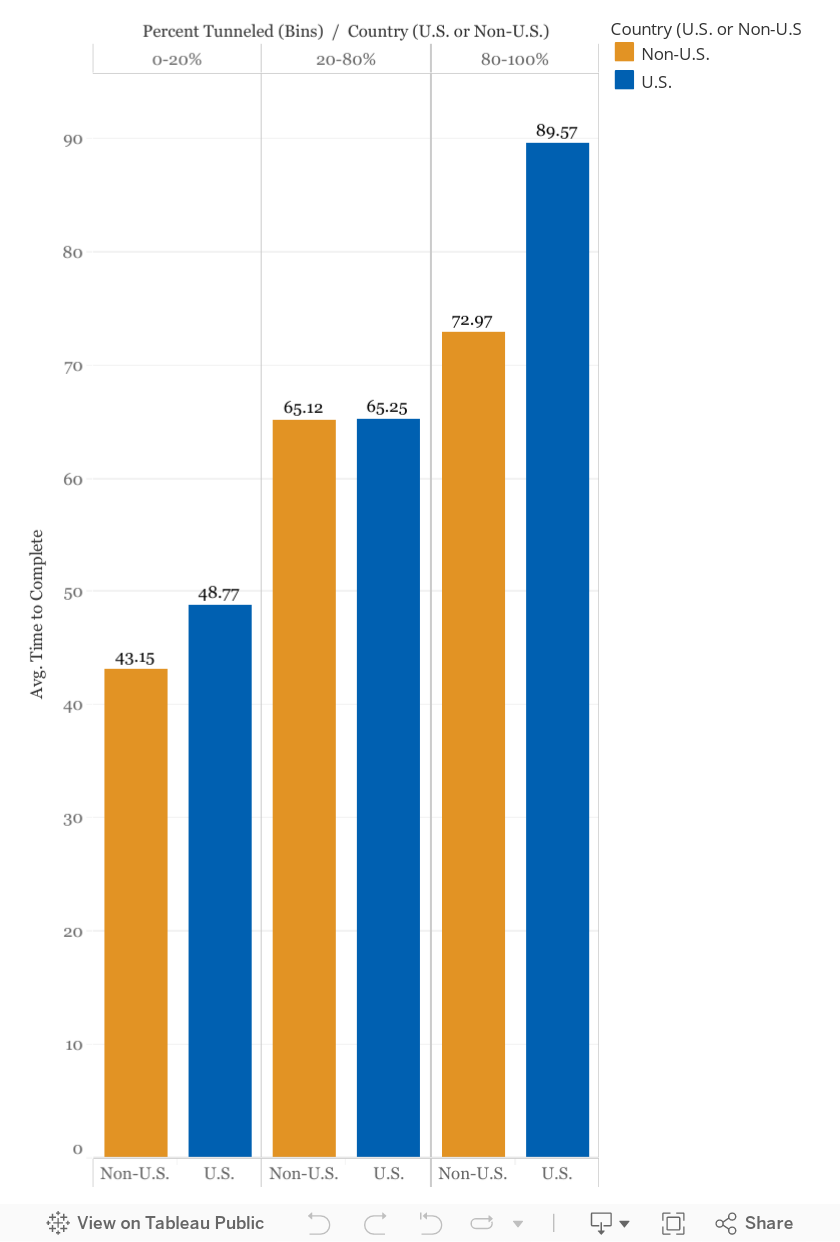
Source: Eno Capital Cost Database
Note: This graphic excludes projects that took more than 150 months to construct. Additionally, the 20-80 percent tunneled bin in the U.S. has only four projects, which limits the takeaways of that portion of the data.
According to Figure 7, projects in the United States that are mostly at-grade take almost six months longer to complete, while projects that are mostly tunneled take more than 16 months longer to complete than comparable projects abroad. But the other countries represented in the database account for many more tunneled projects. In Figure 7, 41 of the 106 international projects are 80 percent or more tunneled, compared to only 8 of the 68 U.S. projects. (Section 5 explores why this is the case).
However, these project timelines only cover the construction period. While unexpected site conditions, scope changes, and other issues arising during construction can affect project timelines, many of the timeline drivers identified in this report, including preparatory sitework, utility relocation, the environmental review process, land acquisition, stakeholder engagement, and lengthy planning periods, are not captured in these timelines. Projects may be proposed in one form or another, but not formally become reality until years or decades later. It is thus difficult to pinpoint a precise and consistent “start” date for transit lines.
FIGURE 8: TIME TO COMPLETE VS. COST PER MILE
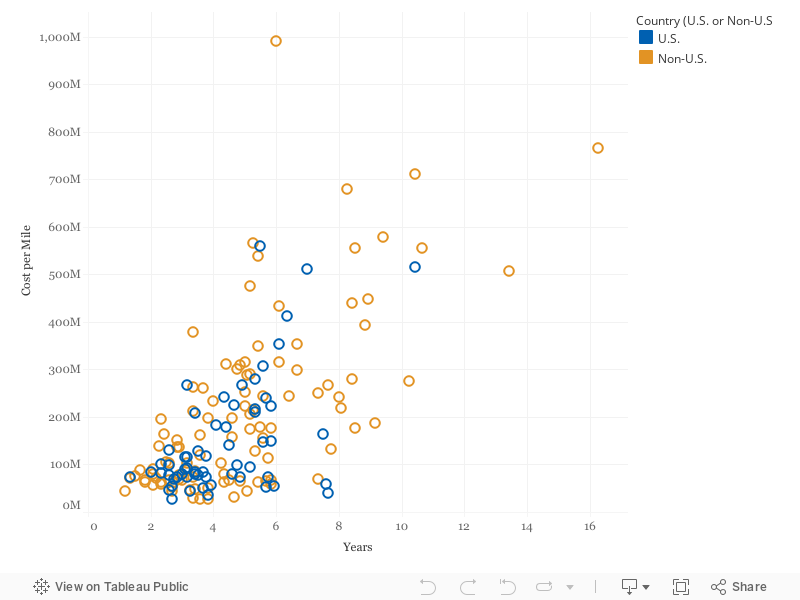
Though the metrics used do not capture the full timeline of a project, there is still a clear relationship between the time it takes to construct a transit line and its final construction cost across both U.S. and international projects. Some of the relationship between time and cost might be attributed to the complexity of a project and its alignments. However, within this database, there is little relationship between a project’s length or grade alignment and its timeline. There is also minimal variation in timelines for new lines compared to extensions of existing lines, though the most notable outlier, the North-South Line in Amsterdam, was a new build. Other complicating factors like the share of project in existing ROW, the density or level of development around the alignment, and geological conditions not captured by this database may further influence timelines. Nonetheless, these findings suggest project timelines themselves can be a significant driver of costs.
BACKGROUND: POTENTIAL COST AND TIMELINE DRIVERS
This section reviews 11 potential areas that have been identified as potential cost and timeline drivers for public transit projects. These cost drivers fall into roughly three categories: governance, processes, and standards. As illustrated in Figure 9 and throughout this section, there is clear overlap among these topic areas and the groupings are admittedly subjective. Nevertheless, they are helpful to understanding the complexities in delivering large transit projects and highlighting the differences between the United States and other countries.
FIGURE 9: CATEGORIES AND TOPICS OF MAJOR POTENTIAL TRANSIT COST AND TIMELINE DRIVERS

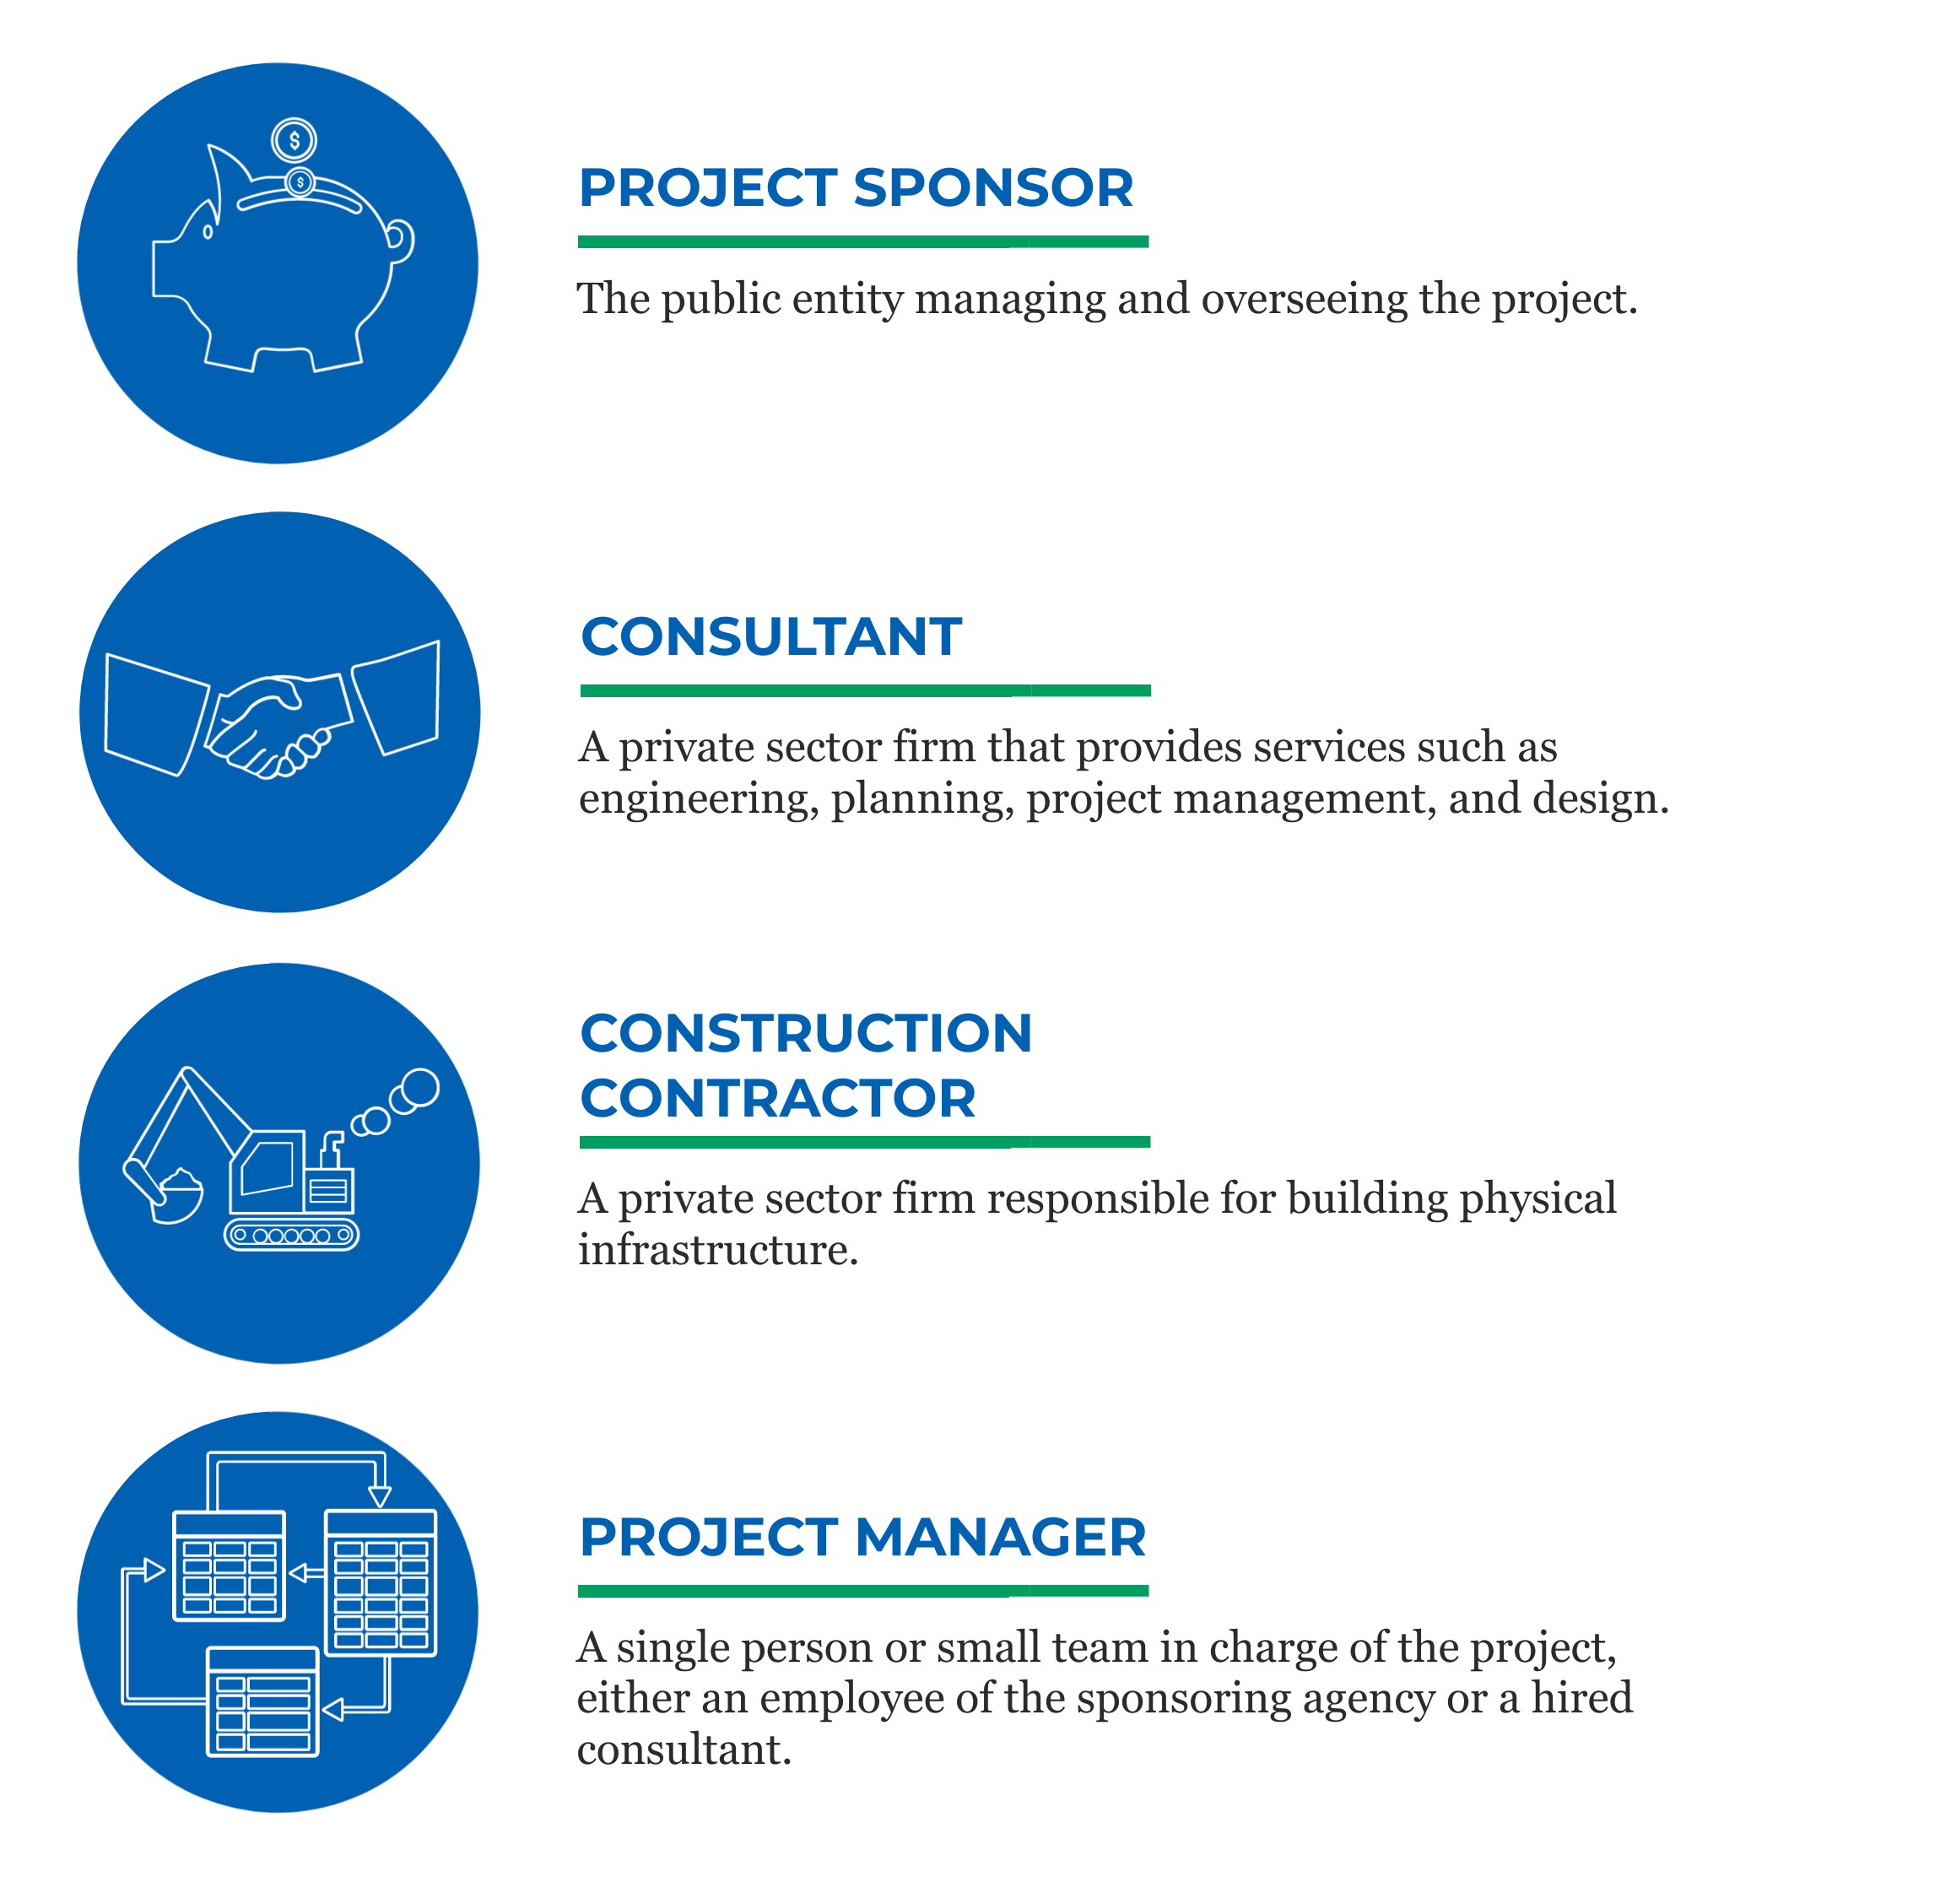
Also, there are terms that describe important actors in transit project delivery. While many terms, like transit agencies, state DOTs, and labor unions are self-explanatory, some terms are used in different ways by varying stakeholders. Figure 10 defines some of the entities frequently referred to in this section.
FIGURE 10: KEY ACTORS/TERMS IN TRANSIT PROJECT DELIVERY
4.1 Institutional Structure and Decision-making
Perhaps one of the most overlooked but most important issues in transit project delivery is institutional governance. Research shows that transit projects can suffer or fail due to lack of focus on establishing the institutional structures that will ultimately deliver and operate the project. The literature shows that setting a clear structure for organizational decision-making responsibility and coordination with other agencies and transportation modes is important to the success of a project.
In the federalist system of the United States, governance for transit is largely devolved to state and local governments which, in turn, develop their own unique way of organizing transit networks and the institutions that govern them. Transit capital projects are often carried out within the existing construction divisions of the same public authorities responsible for bus and rail operations. In some instances, independent special purpose delivery vehicles are used to deliver major projects. Most operating funds come from state and local sources, and federal grants cover a significant portion of capital projects, including rail transit expansions (see CIG summary above).
4.2 Project Delivery and Risk Assignment
Transit projects require the coordinated involvement of public and private actors with varying tasks, risks, and costs. For example, public transit agencies rarely own concrete plants or tunnel boring machines (TBM) and therefore rely on the private sector for design and construction. The scale and scope of the contractual relationship and delivery method between the public agency and private contractors can vary widely and directly affects project success. While there is extensive research on different models, there is no single method that is preferable in all cases, each with advantages and disadvantages.37
The literature describes myriad forms of project delivery but in the United States there are three fundamental methods: design-bid-build, design-build, and construction manager-at-risk.38 These are summarized below and in Figure 11.
FIGURE 11: PRIMARY TYPES OF PROJECT DELIVERY IN THE UNITED STATES

Note: While DBB and CMR have very similar structures, in CMR the Construction Manager is hired early in the process during design, unlike the General Contractor in DBB which is hired after the design is complete.
Design-bid-build (DBB) is the traditional and still most common project delivery method for transit infrastructure. The sponsoring agency first hires an engineering and planning firm to create complete designs for the project. The agency is then responsible for awarding and managing separate contracts to trade-based construction companies based on the designer’s completed plans. The sponsoring agency owns the design details and is usually financially responsible for design errors or omissions encountered by the contractor.39 The majority of the project design control and risk are retained by the public sector.
Design-build (DB) is a model in which the sponsoring agency procures the design and construction elements together in a single contract with a design-builder. The DB entity is often a consortium of several firms and is typically liable for delivering designs and construction costs according to a fixed price identified in the project proposal. Sponsoring agencies often use requests for qualifications (RFQs) then requests for proposals (RFPs) rather than going straight to bid in DB. The risk of cost and timeline overruns are shifted to the design-builder. A proper DB procurement involves the agency giving up control over much of the design specifics. DB projects are generally quicker to construct because construction can begin during design, but they are often much longer to procure than DBB. DB is often referred to as “alternative” project delivery because it is different from traditional DBB.40 DB-based delivery models such as design-build-finance (DBF, sometimes called a public-private partnership, or P3), design-build-operate-maintain (DBOM), and others expand the responsibility of the design-builder and assign more risk to the private sector partners.
Construction Manager-At-Risk, also commonly referred to as “Construction Manager/General Contractor,” or CM/GC, shifts control and risk to the private sector (though to a lesser extent than in DB). In CMR, as in DBB, the sponsoring agency controls and owns the project design. However, a key difference between DBB and CMR is that in CMR, the Construction Manager is selected prior to the completion of design via a pre-construction agreement, enabling them to participate in the design process. The Construction Manager and General Contractor work closely together and, unlike in DBB, contract directly with construction firms to complete the project. This direct contracting arrangement often makes it possible for the project contract to include a maximum guaranteed price.41
While federal law is not a barrier to DB or CMR, there is a patchwork of state laws governing alternative procurement methods. Twelve states do not allow for the use of public-private partnerships for public transportation projects, including both New York and New Jersey, though all but two states (Iowa and North Dakota) allow for the use of design-build.42 Some states restrict the use of alternative delivery methods in part as an attempt to avoid corruption and also because traditional DBB procurements retain most of the risk and control with the public sector, which some states are reluctant to give up. Other states legislate specific exceptions for projects, but the lack of local enabling legislation remains a substantial barrier to broader use of these methods.43 Similarly, some local laws and agency policies limit the use of reimbursable price contracts, restricting pricing contracts to some form of fixed price agreement.44
Due to both inertia and limiting regulations, DBB remains the most prevalent delivery mechanism worldwide. But there is an increasing trend toward alternative methods for shortening timelines and cutting costs persists, with mixed results.45
Pricing Models
Contract structure is a crucial factor in determining the benefits and drawbacks of the DBB, DB, and CMR delivery methods. Agencies often desire to know the total cost of the project up front and set the contract so that the contractor is tied to the projected price. In theory, this arrangement provides significant incentives to private contractors to keep costs down and meet deadlines. In practice, circumstances outside of the contractor’s control often lead to “change orders,” which drive up project cost beyond what was anticipated in the original contract (see Section 4.4). This pattern of discrepancy has led to the development of several different methods for pricing construction projects, each with its own advantages and disadvantages. Ultimately, the pricing mechanism decision revolves around balancing the allocation of financial risk and costs among all parties involved.46
Fixed Price contracts can be structured either as unit price or lump sum. In unit price contracts, the contractor fee is based on a measurable deliverable. For example, a contractor would receive a specified amount for each length of subway track completed (typical agreements contain many unit costs). The unit price includes labor, materials, overhead, and profit. Unit price contracts can be helpful when specific delivery quantities are unknown or expected to change during the design and construction process and can also help with contractor cash flow during long-term projects. Fixed unit pricing is common for urban rail projects and DBB delivery methods, and some research suggests it is preferred by contractors.47
Lump sum contracts are inclusive of all materials, labor, overhead, and profit. This contract structure transfers significant risk to the private sector and provides a strong incentive to complete the work efficiently.48 Lump sum contracts are common for smaller, discrete tasks. For large, complex projects, lump sum contracts can force contractors to include significant cost buffers, driving up overall costs.
Many agency policies require that a contract include an upfront, fixed price, in part because sponsoring agencies have a strong desire for budget control and certainty. But using a CMR-type procurement often requires some kind of reimbursable or guaranteed maximum pricing scheme given the uncertainties in the design and subcontracting process.49
Reimbursable Price contracts provide compensation to the contractor for the project costs, including labor, materials, overhead, and profit. It is structured either as a “cost-plus” contract in which the contractor is reimbursed for labor, materials, and overhead and then given a percentage-based profit, or as a “fixed fee” contract in which the contractor is similarly reimbursed but the profit and overhead are fixed rather than percentage-based. Reimbursable price contracts are most commonly used for complex projects involving high-risk estimating.50 Agencies must exercise additional oversight of reimbursable price contracts in order to limit the potential for wasteful spending given the lack of incentive for cost containment.
A Guaranteed Maximum Price contract is a combination of fixed- and reimbursable-price models in which the contractor is reimbursed and paid a fee, up to a previously-agreed-upon limit. If the cost of the project exceeds the limit, the contractor is responsible for covering the overrun. If the costs are less than the maximum, the sponsoring agency and the contractor split the remaining budget, creating an incentive to keep costs low. But guaranteed maximum price contracts can provide a false sense of security if set too low, and they have the potential to precipitate adversarial relationships similar to those created when lump sum contracts are underbid.51
Industry trends indicate that guaranteed maximum and reimbursable cost pricing might become more common in the future. Some project managers say that lump sum fixed price contracts are simply not compatible with the complexities of tunneling.52 With cost overruns on fixed cost projects becoming more prevalent, major firms are declaring a desire to not bid on fixed cost projects.53
There is no single consistently preferred delivery method for large transit projects.54 In fact, a review of several projects at Los Angeles Metro found different results for DB and DBB projects, with no single method consistently performing better than another.55 Research suggests sponsoring agencies tailor the project delivery model to align with staff capacity at the agency, project characteristics, and the state of the market and they should do so early in the project—during project scoping, if feasible.56 However, most agencies, even those with robust capital programs, do not have formal processes for selecting a project delivery method. Such a process can be formalized and conducted on a project-by-project basis, weighing several interrelated factors:
Cost
When it comes to project delivery methods, the literature mostly agrees that delivery method has a small effect on the overall cost of the project. A study of nine U.S. transit projects found that the use of DB and CMR did result in some cost savings over DBB projects.57 Some of these savings may be attributed to the avoidance of cost overruns related to design and scope changes that the sponsoring agency typically bears under DBB.58 Another study showed that no single delivery system performed best in terms of unit costs.59 Other research indicates that DB and CMR project delivery methods appear to have a positive effect on cost certainty even if they do not deliver lower cost projects.60
Experience in Los Angeles shows that DB projects can run into problems when designers do not account for utility relocation (a major cost driver, see Section 4.5) and when the DB entity does not have the relationships and experience needed to coordinate utility relocation with other entities. This shortcoming significantly increased costs for DB projects in Los Angeles.61
Timeline
By combining the design and construction firms into a single entity using DB or CMR methods, construction can begin very early in the process while the design is still unfinished.62 In this way, DB is specifically noted as a way to meet aggressive delivery schedules or to approach projects that need to be fast tracked.63 Of course, DB is not a panacea for paring back timelines. Citing the DB examples in Los Angeles, accelerated construction timelines led to problems being discovered much later in a project, making them more expensive to resolve and subsequently increasing costs.64 Regardless, if length of construction time is more important than cost, it appears that using DB or CMR might be helpful for accelerating timelines.
Size and complexity
Some experts say that large, complex projects are good candidates for DB given the need for greater experience from the private sector while DBB may be appropriate for smaller, more manageable projects. Based on his experience in Madrid, Maynar recommends that the large tunneling projects use DBB in order to separate design from construction, allowing for more flexibility and control by the agency.65 It is important to note that neither project size nor complexity alone typically affects the choice of delivery method.66
Innovation
Alternative delivery methods allow for more innovation (loosely defined in the literature) in design and construction because the construction team can communicate more closely with the design team to make design adjustments that enhance constructability.67 Rather than providing 100 percent completed design documents as the basis for construction contracts, agencies can instead specify a set of performance criteria for DB projects. This approach was cited as a major cost-saving measure in the Denver Eagle P3 project, which utilized a design-build-finance-operate-maintain (DBFOM) delivery model.68 Instead of providing detailed design specifications as traditionally done under DB projects, the agency provided 30 percent design documents and high-level performance standards as reference materials to maximize bidders’ design flexibility and creative freedom. The P3 team credited the use of performance-based procurement in lowering project costs, with the winning bid coming in $300 million below the agency’s original cost estimate.69 Maryland’s Purple Line project, also a DBOM, proposed a higher-voltage system that required fewer substations, reducing overall costs.70 Although not all demonstrate significant cost savings during construction, small changes that improve constructability can effectively improve overall project design.
Staff capacity and experience
It is the responsibility of the sponsoring agency to retain sufficient, high-quality staff to manage a project. The delivery method selected determines the kinds of skills staff needs to have to successfully execute the project. For DBB, the public sector is in control of the project at all times, and thus staff need to be skilled in project management. Many failings of DBB projects often result from inadequate management of the various contractors, which affects the overall progress of the project.71 This problem seems to be particularly acute within smaller agencies.
DB projects need personnel with project oversight skills. With hundreds of millions of dollars at stake, agency staff must be vigilant in providing strong and active oversight.72
For example, a DB firm might produce a design that is cheaper to construct but that does not have a long life cycle before significant maintenance is needed. Because they have no direct long term stake in the project (aside from reputation), a DB firm might choose a poor outcome for the agency without such oversight.73 Quality assessment and quality control procedures are vital to ensure a lasting product, but many agencies do not invest enough planning and resources into creating such a system.74 Providing a contract to operate and maintain the asset for several decades builds in an incentive for life cycle cost planning, but few examples of DBOM transit projects exist.
Competition
Under traditional DBB procurements, a project sponsor may choose to bring on a single prime contractor to oversee project development and construction, or instead award individual project components under separate contracts to multiple prime contractors.75 Combining contracts into a larger package may be more attractive to bidders and allow the project to benefit from economies of scale and the consistency of a single entity to deliver the entire, integrated project. However, it may also limit competition to a handful of larger firms due to project size and complexity, either pricing out smaller contractors or relegating their involvement to the role of subcontractor.76 Dividing a project into several smaller contracts may increase competition, potentially lower costs, and provide more opportunities for small contractors to serve as primes, but it can also introduce more complexity by requiring project sponsors to coordinate several prime procurements and manage a larger group of contractors.77
4.3 Procurement Specifications
How agencies legally obtain goods and services—from vehicles and parts to engineering and construction services—is a major element of any transit project. The FTA requires agencies to ensure full and open competition when procuring goods and services, as well as adopt written codes of conduct to prevent any emplo yee or board member with a conflict of interest from participating in the “selection, award, or administration of contracts.”78
4.4 Soft Costs and Change Orders
Transit project construction cost estimates inform a range of project aspects, including design, alignment, financing strategies, and community reaction. While there has been significant attention to the measurement of hard costs—physical elements of a project like vehicles, tracks, stations, and steel—soft costs are overlooked and understudied.
Soft costs typically encompass activities and services needed to plan, build, and start up a transit project aside from physical construction. Examples include design and engineering services, legal work, security and safety analyses, environmental review, risk assessment, cost estimation, administration, and project management.97 While few studies have directly analyzed the magnitude and scope of soft costs, research shows they have increased over time. There is no consensus on a specific source of increases but some research points to poor project management practices that lead to excessive change-orders, high contractor profit margins, long planning phases, unusual political influence, and project complexity.98
4.5 Utility Relocation
A major element of transit construction, particularly for rail projects, is the relocation of utilities along the proposed alignment. These may include power, water, gas, phone, internet, and sewer lines often owned by private sector enterprises with completely different goals and motives. Transit projects can cross utilities both above and below ground, requiring them to be moved vertically, horizontally, or both. It is among the most complex elements of transit projects, and one of the most common reasons cited for issues and project delays.12
4.6 Land Acquisition
The acquisition of land and ROW is necessary for any transit project and its route, grade alignment, stations, and maintenance facilities impact specific land needs and costs. Federal and state regulations, including eminent domain laws, environmental statutes, and other statutes governing the purchase of property for infrastructure projects, also influence the land acquisition process and costs.137
4.7 Environmental Review
A variety of federal laws, rules, and regulations govern environmental review of federally funded transit projects in the United States. Compliance with these standards falls under the process established in 1970’s National Environmental Policy Act (NEPA), but also involve more than two dozen other federal statutes that span several federal agencies. NEPA acts both as a holistic method of determining the environmental impact of a federal undertaking and as a collection point for the many permits and consultations required under federal environmental law.158
While a few transportation projects are exempted from complete environmental review, a full environmental impact statement (EIS) is typically required of projects built in new ROW. Completing an EIS is often a long process (a median of 3.6 years for EIS completion time) that can contribute to project delivery time and costs. There is general bipartisan support for streamlining the environmental review process, but the approach to do so is either unspecific or divisive.
The emphasis on sources of delay due to environmental protections tends to be on the process of implementing those protections rather than on the standards or stringency of the protections themselves. Some suggest that conforming to environmental mandates may even prevent project delivery delays due to litigation or redesigns later in the process.159
While NEPA is often cited as a source of delay, the law has als o enabled projects to be more responsive to local needs and reduced adverse environmental impacts.160 NEPA has become the primary method for engaging with and informing the public of project details, and thus serves an important role in community engagement. Disagreements about how to proceed given different project alternatives are associated with delays in the overall NEPA process. Finally, many of the preliminary engineering decisions made about a project occur during the NEPA process and would have to occur irrespective of NEPA.
NEPA requires federal agencies to assess potential environmental effects and evaluate any significant impacts in advance of proposed major federal actions prior to making final decisions about how to implement those actions. These may include decision-making about permit applications, adopting federal land management actions, and constructing publicly-owned facilities like federal highways. “Effects” can be the result of direct or indirect actions and include ecological (i.e. effects on natural resources), aesthetic, historic, cultural, economic, social, and health outcomes.161 In this sense, the definition of environmental effects constitutes not only natural resources (e.g. air, water, and ecological resources), but also historic, social, and cultural resources (e.g. historic properties, districts, and archaeological sites).
NEPA applies to highway or transit projects with any federal nexus, including direct federal projects, federally permitted or approved projects, or any project receiving federal funding assistance. Projects that do not use federal funds or require federal permits or authorizations, like preparation of a regional transportation plan, typically do not require NEPA review but may be subject to similar state- level environmental review processes.162 While NEPA is largely procedural (i.e. primarily encompassing assessment and disclosure of environmental impacts), parallels at the state level are in some cases more stringent in that they are both procedural and substantive, in some cases requiring mandatory mitigation efforts.163
The Council on Environmental Quality (CEQ), an entity within the Executive Office of the President, is tasked with oversight of NEPA implementation and the development of national environmental quality recommendations and policies. The regulations established by CEQ are binding on all federal agencies. Federal agencies also supplement CEQ regulations by establishing their own NEPA procedures that reflect their agency’s mission. A federal agency’s NEPA procedures reflect their internal statutory requirements, regulations, and guidance. Typically, a single federal agency is designated the “lead agency” responsible for NEPA review for the proposed action based on expertise and relationship. If more than one agency has expertise on resources impacted by the proposed project, those agencies will also conduct assessments, though the lead agency typically has the biggest review responsibility.
To comply with NEPA and receive federal funding, transit project sponsors must consult with FTA. The project sponsor prepares statements that assess a project or action’s environmental impacts as well as the potential effects of alternative projects or actions.164 Alternatives can be determined through local planning processes or based on prior transportation project planning studies. Through an approach called planning and environment linkages (PEL), transportation planners and NEPA practitioners can coordinate their analysis efforts to potentially accelerate project delivery. However, the application of this approach to transit projects has been limited. Through the NEPA process, FTA and the project sponsor work together to devise a list of economically and technically feasible “reasonable alternatives”.165 FTA is responsible for ensuring that NEPA documentation is complete.
The assessment statements prepared by FTA or the responsible federal agency falls into one of the following categories:
- Categorical Exclusions (CATEX or CE): Certain types of federal actions are categorically excluded from a full environmental analysis because they are considered to not individually or cumulatively have a significant effect on the environment. The federal code lists these types of actions, which require only administrative approval because past experience has demonstrated that these project types or categories do not involve significant environmental impacts. Examples include utility poles, power substations, energy retrofits, training, landscaping, and technology upgrades.166
- Environmental Assessments (EA): If an agency determines that a CE does not apply to a proposed action, it prepares an EA. An EA includes: discussion of the need for the proposal; alternatives; environmental impacts; and a listing of agencies and individuals consulted. The EA process determines whether a project will have significant environmental impact. Once the EA is completed, the agency either issues a Finding of No Significant Impact (FONSI), which describes why the agency believes there are no significant environmental impacts, or it prepares an Environmental Impact Statement.
- Environmental Impact Statements (EIS): If a proposed action may significantly affect the human environment as defined by NEPA, a federal agency will issue a Notice of Intent and begin preparation of an EIS in conjunction with the sponsoring agency. An EIS includes information about the agency and the action it intends to take; the purpose and need of the action; alternatives; a description of the affected environment; and direct and indirect environmental consequences, among other details. An EIS is required for the construction of transit facilities not located within an existing ROW.
Since 2010, FTA has prepared over 50 EA/FONSIs, and over 30 RODs.167 The ROD is the document that identifies the preferred alternative as determined by the EIS process.
Because NEPA serves as “umbrella” legislation over other federal environmental laws, project sponsors typically need to obtain supplemental federal permits or perform certain project-specific analyses to satisfy various federal environmental statutes (see Table 3).
TABLE 3: FEDERAL ENVIRONMENTAL STATUTES MOST LIKELY TO AFFECT MASS TRANSIT PROJECTS

Historically, costs and timelines for processing NEPA reviews have not been tracked in detail for transit or highway projects. Transit agencies and FTA representatives interviewed in a GAO report have indicated that costs associated with NEPA review are not tracked because it can be difficult to discern whether costs are to be attributed to the NEPA process or to the planning and preliminary design phases of project delivery.168 However, one analysis of environmental costs incurred by State DOTs indicated that while environmental costs may range from two to 12 percent of total project costs, the majority of those costs were likely to be for mitigation actions like stormwater facility construction and erosion control, though the same study listed a number of barriers to tracking environmental costs.169
The time and expense needed to conduct environmental review is oft-cited as a challenge in complying with federal requirements.170 State and local transportation officials have identified limited funding and staffing, responsibilities beyond transportation projects, and difficulty coordinating between multiple government agencies as contributors to increased costs and delays associated with the NEPA process.171 NEPA review is included in the project budget, and can come from a mix of federal, state, and local funding sources such as FTA New Starts funds, funds from toll road revenues, grant funding, and state transportation fund accounts.172 Transit agencies frequently rely on contractors to conduct specific elements of NEPA review, such as noise, air quality, and traffic analyses. However, this requires the agency to allocate funds from the project budget toward procuring external assistance. These costs are typically reported among the project management costs.173 Costs associated with environmental reviews are considered a soft cost (see Section 4.4), though there is not a separate line item in FTA’s Standard Cost Categories to exclusively track NEPA costs. Instead, environmental review is bundled with other design, engineering, and legal activities.
While more complex projects typically require more time to complete NEPA documentation, the length of time from the NOI to the ROD may or may not be directly related to NEPA. For example, there may be starts and stops in the process of documentation due to challenges coordinating with other agencies, changes in agency priorities, lack of staff availability, insufficient funding, community opposition, or engineering requirements.174
CEQ studied all 1,161 final EISs across all federal agencies published from 2010 through 2019 and determined that the average EIS completion time from NOI to ROD was 4.5 years, with a median of 3.6 years.175 On average, the period from the original NOI until the publication of the draft EIS took between two and three years, the period from draft EIS to final EIS took over one year, and the period from final EIS to ROD only took a few months, as shown in Figure 12.
FIGURE 12: AVERAGE EIS PROCESS COMPLETION TIME (NOI TO ROD), ALL EISS AT ALL FEDERAL AGENCIES COMPLETED 2010 – 2019
")
Source: CEQ 2020
However, the average duration of the EIS process is highly dependent on the type of project being built, and transportation projects are significantly longer than other types of actions. The 319 EIS documents issued by the Department of Agriculture averaged just over three years from start to finish. But the 185 EISs prepared by the Department of Transportation took longer than any other agency—almost seven years, on average, as Figure 13 shows. Thirty-nine DOT projects took longer than 10 years from NOI to ROD (33 of which were FHWA EISs).176
FIGURE 13: AVERAGE COMPLETION TIME (NOI TO ROD) FOR FEDERAL AGENCY EISS COMPLETED BETWEEN 2010 AND 2019
")
The CEQ analysis shows that the FTA was the lead agency for 31 of the projects that completed the NEPA process between 2010 and 2019. For those 31 projects, average and median NEPA processing times vary because of two outliers (the Charlotte Lynx light rail and the Maryland Purple Line). The median overall time, start to finish, is 50.2 months, or just over four years, as shown in Table 4.
TABLE 4: NEPA PROCESSING TIME FOR DECISIONS WHERE THE FTA WAS LEAD AGENCY, 2010-2019 (MONTHS)

The CEQ analysis shows that the FTA was the lead agency for 31 of the projects that completed the NEPA process between 2010 and 2019. For those 31 projects, average and median NEPA processing times vary because of two outliers (the Charlotte Lynx light rail and the Maryland Purple Line). The median overall time, start to finish, is 50.2 months, or just over four years, as shown in Table 4.
As of 2018 there have been about 30 provisions enacted into law to streamline the NEPA process, with the first provisions enacted in 2005’s SAFETEA-LU law. The GAO groups these provisions into four categories:
- Accelerated NEPA review: excluding certain actions from more detailed NEPA review;
- Administrative and coordination changes: changing processes to avoid duplication, establish time frames, and create planning documents;
- Assigning NEPA review to states: except for air quality review, allowing states to review EIS, environmental assessments, and some categorical exclusions;
- Advance planning: provisions such as land acquisition that occur prior to NEPA approval.177
The provisions largely encompass expansions of categorical exclusions to different types of projects and situations. In part because transit agencies do not track the costs and delays associated with the NEPA process, and because not all provisions have been used by all agencies, it is difficult to ascertain exactly how these provisions have affected project delivery for transit. The provision that was reported to be used most and to be most successful in speeding project delivery for both highway and transit projects was “Minor Impacts to Protected Public Land”, which allows project sponsors to bypass environmental assessment if a project will have minimal effects on historic sites and parklands.178 For the Chicago Transit Authority, this provision was expected to speed project delivery by several months.179
While legislative reforms have led to some gains in streamlining project delivery, they have not been entirely successful. A recent report from the DOT Office of the Inspector General found that of the 42 planned actions listed in MAP-21 to streamline project delivery, only 27 had been completed. Full implementation was delayed because DOT had to revise several actions to comply with the subsequent FAST Act.180
Since NEPA was first signed into law, a number of Executive Orders (EOs) have been issued by presidents that have altered the scope of information agencies are to obtain when conducting their environmental reviews (see Table 5). EOs outline the responsibilities of federal agencies when administering environmental permits, thereby altering the information that agencies are required to submit.
TABLE 5: RECENT EXECUTIVE ORDERS ISSUED RELATED TO ENVIRONMENTAL REVIEWS

In 2007, the National Surface Transportation Policy and Revenue Study Commission recommended a number of reforms to reduce project development delays, including eliminating the need to revisit alternatives that were previously rejected in the planning process, revising CEQ regulations to narrow the number of alternatives considered “reasonable”, and requiring better coordination between federal agencies.181 The alternatives analysis required by NEPA often duplicates a similar analysis required by FTA’s New Starts program. The Surface Transportation Assistance Act marked up by the House Transportation and Infrastructure Committee in 2009 suggested eliminating the alternatives analysis required in the New Starts program, but this was ultimately not adopted into law.182
California has its own environmental review law that is famously more stringent than NEPA. In response, federal law was changed in 2005 to allow U.S. DOT to assign some of its responsibilities under NEPA to states, a provision that is available to both highway and transit projects but to date, has primarily been used for highway construction. Under this law, state DOTs can conduct NEPA reviews and approvals on FHWA’s behalf, though FHWA still retains liability for decisions.183 The NEPA Assignment provision was originally enacted as a pilot in SAFETEA-LU with the goal of speeding up the environmental review process and has since been enacted in seven states through the Surface Transportation Project Delivery Program created in MAP-21.184 Delegation of NEPA responsibility can also allow states to use their own resources, thus decreasing the likelihood of delays caused by state DOTs needing to obtain project-specific approvals from FHWA.185
States must first assume FHWA’s responsibility for NEPA compliance for at least one highway project within the state before they can do the same for a railroad, public transportation, or multimodal project. This process for assuming authority can pose challenges, as it may lead to a situation in which a state presides over NEPA review for a highway project while the appropriate federal agency maintains authority over other project elements. Further, states—but not transit agencies—can assume responsibility for determining whether an activity qualifies for a CE. Given both of these challenges, the potential effects of NEPA Assignment on multimodal projects are unknown.186
The few states that have pursued NEPA Assignment have reported cost and time savings. For example, Ohio DOT estimates a 20 percent time savings and $45 million savings in overall program delivery. Texas DOT estimated a reduction in the average time to conduct an EA from three years before state assignment to two years. However, these examples are limited to highway programs and a comprehensive study of nationwide NEPA Assignment cost and time savings has not yet been conducted.187 Of the states whose NEPA programs have been evaluated, the available information pertains to a limited number of projects and fails to consider how other factors like funding can affect project timelines.188
When an EIS is required for a project, the lead agency must coordinate with resource agencies that have purview over the resources potentially affected by a project, such as the Fish and Wildlife Service or the Federal Aviation Administration (FAA). In addition, the requirement that projects comply with all federal, state, and local environmental laws means that the NEPA process necessitates close coordination among a number of agencies at all levels of government.189
It is unclear whether recent attempts at better federal coordination have been successful.190 There is little indication that the “Administrative and Coordination” provisions in recent transportation legislation have led to improvements in project delivery. Rather, most of these provisions have either had no effect or the effects cannot yet be measured, as indicated by state DOTs.191 Still, efforts specifically aimed at early coordination—between permitting agencies and between planning and environmental staff—might help to mitigate a number of risks that, if unaddressed, may result in time-consuming litigation associated with the NEPA process.192
A 2005 report for a working group focused solely on improving analysis of indirect and cumulative impacts, for the agencies that conduct such analyses, indicated that early coordination between agencies would help to foster agreement on issues about the resources most likely to be affected as well as the temporal and spatial boundaries of analysis. The provision of guidance and information resources to support better coordination could help to “avoid misunderstandings and conflicts that can lead to delays in project development”.193
In 2011, FHWA launched the “Every Day Counts” (EDC) to help find best practices. Through EDC, the FHWA and its regional offices work with state and local agencies as well as private sector firms to collaboratively identify innovative delivery practices and rapidly scale their utilization through regional summits, webinars, and written materials focusing on best practice sharing. EDC innovations include design and construction practices, procurement and delivery models, public outreach, and innovative finance. Since its inception, 52 discrete and specific innovations have been identified and each state has employed at least one.194
Legal issues are often cited as a major source of NEPA-related project delays, though the issues that spur litigation are complex. Of the many types of events identified as potentially inciting litigation, two in particular receive the most attention: use of NEPA to delay or stop a project by interests such as community coalitions or environmental organizations who oppose the project, and lack of agency compliance with NEPA procedures.195 Across all federal NEPA actions, only 0.22 percent result in litigation.196 This is because the vast majority (95 percent) of federal actions are evaluated as a CE, with less than one percent of federal actions requiring an EIS. While NEPA litigation has declined since the 1970s, there is concern that the potential for litigation still affects the NEPA process through the extra time and effort expended by project sponsors to prepare legally-sound documentation.197
The primary reasons for filing NEPA lawsuits are inadequate NEPA documentation (e.g. the EIS or EA did not include sufficient analysis of all alternatives, did not consider all “reasonable” project alternatives, or did not adequately analyze cumulative or indirect effects) and failure to prepare an EIS rather than an EA (e.g. inappropriate selection of assessment process).198
As shown in Table 6, 39 cases were brought against FTA between 2001 and 2013, compared with 96 against FHWA, 46 against the FAA, and 7 against other agencies within DOT.199 Cases brought against FTA represent just over 2 percent of all NEPA litigation.
TABLE 6: NEPA CASES BROUGHT AGAINST TRANSPORTATION AGENCIES FROM 2001 TO 2013

Source: Ruple and Race 2020
Public involvement efforts, a fundamental piece of the environmental review process, often provide the forum in which project opposition is addressed. Levels of public involvement vary depending on the type of NEPA review (i.e. EA vs EIS) and the specific agency conducting the review. In general, agencies are required to offer 45 days for the public to comment once a draft EIS is prepared. Two Supreme Court cases have held that issues must be raised at an early enough point in the process to be “meaningfully considered” unless there is a flaw in the agency’s analysis.200
The CEQ notes that, “the success of a NEPA process heavily depends on whether an agency has systematically reached out to those who will be most affected by a proposal, gathered information and ideas from them, and responded to the input by modifying or adding alternatives, throughout the entire course of a planning process.”201
For reviews that warrant an EIS, the project sponsor is required to conduct a “legal sufficiency” review to ensure that the proposal is legally sound and accounts for all available information. Some have expressed that this review is overly risk-averse and may slow down the process.
|
Commonly cited reasons EISs for transportation projects have been found inadequate in court cases. 202 |
|---|
|
Twenty jurisdictions (states, territories, regions, and local jurisdictions) in the United States have their own environmental review processes, and other states have laws in place to address specific environmental issues, like wetlands protection.203 In some cases, as with the California Environmental Quality Act (CEQA), these reviews are considered more stringent and has more substantive requirements and mitigation mandates than federal environmental review.204
In these cases, the lead federal agency can authorize states to use their own requirements to meet the federal standard per Section 1309 of the FAST Act. In California, a single combined EIS/EIR (environmental impact report) that bundles the federal and state reviews together is prepared. Some states have indicated that administrative responsibilities associated with NEPA add time to project delivery that would otherwise be prevented if only the state review was required.205 States can also choose to forego the use of federal funds to save time and costs – thus avoiding the federal NEPA review process – though time and cost savings may be negated in states with environmental requirements like those at the federal level. However, using nonfederal funds can create problems if the project later uses federal funding and must meet federal requirements.206
Individual transit agencies usually have their own environmental review criteria that must be done in conjunction with NEPA review for any project. Typically, this is met by complying with NEPA, though there is some administrative work to put the analysis into agency-specific terms. For example, a transit agency may set its own noise criteria standards in addition to those established by FTA.
Many transit agencies have adopted several other environmental standards for their construction efforts. For example, among the first efforts LA Metro undertook to improve environmental standards in their building practices was the adoption of a Green Construction Policy to reduce emissions from construction equipment in 2011.207 Since then, the agency has established a Sustainability Plan, Rail Design Criteria, and the Metro Environmental Construction Awareness (MECA) program. Through MECA, contractors and sub-contractors can access video, text, and internet resources specific to environmental regulations and best practices for composing a proposal.208
Environmental review is a major element of transit projects and their schedules, though the precise cost of environmental assessments and the extent to which delays are solely attributed to environmental review versus other project development stages can be difficult to pin down. Delays associated with environmental review on projects are primarily a result of the process, rather than the standards themselves. The environmental review process takes an average of seven years to complete for transportation projects, and the potential for litigation can contribute to additional delays. Litigation may result from project sponsors failing to meet NEPA requirements, or from opponents seeking to delay or stop a project. These lawsuits primarily allege inadequate documentation, or failure to consider all reasonable alternatives. Early, proactive coordination among agencies responsible for elements of the environmental review, as well as setting firm geographic and temporal boundaries on the extent of environmental impact analyses have been cited as tools to avoid disagreement and delays during the NEPA process.
4.8 Buy America
Mass transit procurements over $150,000 using FTA grant funds are subject to a “Buy America” requirement first adopted by Congress in 1978. Under 49 U.S.C. §5323(j), all “steel, iron, and manufactured goods used in the project” must be produced i n the United States. For rolling stock (including train control, communication, traction power equipment, and rolling stock prototypes), the standard is not quite as high— the cost of all components and subcomponents made in the United States must be at least 70 percent of the total cost for all rolling stock compon ents, and final assembly must have occurred domestically.209 The intent of Buy America is to leverage public infrastructure dollars to support and grow domestic manufacturing, but it has some potential cost and timeline consequences for transit projects.
4.9 Planning and Community Engagement
Planning helps decision-makers, elected officials, and the public translate goals and visions into a specific, prioritized projects for a region’s transit network. Planners at public agencies work with communities and other agencies to pursue projects that meet their criteria. This involves a multi-step process with frequent interaction with the public and demand models to predict future impacts.
4.10 Architecture and Design
Design specifications are a core element of any transportation project, and agencies often spend a significant amount of money on preliminary design. Design decisions determine whether a project is constructed at-grade, above-ground, or below-ground, along with the depth and size of stations. Other elements of station design include platform size and layout, vertical access (escalators and elevators), construction materials, and aesthetics.236 These specifications are informed by a range of factors including expected passenger capacity, environmental considerations, physical site characteristics, agency preference, and compatibility with existing systems, among many others.
There is significant debate over the impact of architectural and design elements on project costs. Some research cites large, grandiose, and overly-customized stations as a major cost driver, while examples from Toronto have pointed to station depth— rather than design—as a primary determinant of cost (building deeper can be a result of geological constraints, but also a desire to minimize disruption at surface level).237 Other research and examples from New York City points to management of the design process and design quality as a potential driver.238 Projects typically undergo a series of design and constructability reviews to resolve errors and ensure that the project can be built as designed. Poor project design or incomplete design evaluations may require change orders or other modifications if major errors or issues arise during construction, leading to further delays and cost increases. An over-designed project—one whose initial capacity far exceeds its short-term expected capacity—may also incur unusually high construction and operating costs while an under-designed one may result in significant costs down the road in the form of expensive modifications.
Assessment of project design quality is dependent on a variety of factors, including an agency’s technical expertise and the contracting method used. Design assessment can be conducted in-house by agency staff, by outside consultants, or by a hybrid team.239 In a DBB process, projects typically undergo a series of three design reviews during the Final Design phase—sometimes referred to as 30-percent, 60-percent, and 90-percent reviews. The FTA establishes a set of recommended protocols for design quality assessment during each phase.
Some projects undergo a less formal peer review, in which peer agencies or other independent external entities evaluate and offer feedback on a range of possible topics including a project’s design, budget, or timeline. While peer review is required for Small Starts projects and for midsize projects funded by the FTA’s CIG program, it is not a requirement for larger projects. Such reviews tend to enhance the project development process and ensure compliance with common standards rather than improving specific project elements.
Flawed project design processes have been cited as a major cost driver in New York City, particularly for the East Side Access and Second Avenue Subway projects. Project design and constructability reviews in New York are often performed by contractors overseen by the agency. During constructability reviews, limited access to construction sites led to incomplete assessment of site conditions, while poor evaluation of initial design documents resulted in alterations and change orders during construction.240 Analysis by the MTA’s Office of the Inspector General found that design errors or omissions were some of the most common causes of frequent change orders.241 The prevalence of change orders and design-related delays underscores the effect that design review quality and management can have on overall project cost and schedule.
Additionally, extended project planning phases can lead to over-customized specifications that require expensive procurement, complicate construction, and inflate costs. The Second Avenue Subway and East Side Access projects both underwent several rounds of design. When planning phases are extended over several years, there is an increased risk of technology or standards in the initial design becoming outdated before construction starts, leading to change orders, delays, and cost increases.242 Extended planning phases may also prompt contractors to overdesign projects as a way to manage the potential risk of inadequate design, further inflating construction costs.
DB projects tend to involve unique design evaluation methods viewed through the lens of three variables: cost, schedule, and quality.243 Under DBB, agencies and project sponsors provide a completed design and desired completion date, leaving bidders to compete over the price needed to complete the project. Under DB, agencies will provide specific performance criteria and project schedule, leaving design and cost as the variables in bidder competition.244 Agencies who pursue DB often need to define and evaluate design quality in a more detailed and precise manner than they would for a DBB project.
The degree to which project owners utilized these potential design assessment approaches varied greatly. One study’s review of DB RFPs indicates that project owners may be insufficiently evaluating design bids. Nearly 30 percent failed to ask for the design/builder’s past qualifications, and 43 percent failed to evaluate the bidder’s approach to delivering project quality.245 While a majority of projects required post-award submission of a quality management plan for construction, less than a third required a similar plan for project design. These patterns suggest that project sponsors may be relying solely on review of design submissions to evaluate project quality and missing opportunities to establish quality management plans. While most of the highway and rail projects reviewed included both design and construction quality management plans, transportation projects made up a small portion of the RFPs reviewed in the study. These findings nonetheless demonstrate the role of design evaluation in the project development process and suggests the need for rigorous design quality assessment practices for DB projects.
Among the design elements frequently cited as a major cost driver are stations, particularly for subway projects. Various elements of transit stations, including size, construction materials, depth (if underground), and tunneling method can contribute to project costs. Larger, deeper, and more complex stations may incur significantly more construction costs than smaller and simpler stations.
Station Depth
Data from projects in the United States, Canada and Europe suggest that station depth may play a significant role in driving construction costs. When compared to projects in Los Angeles, Paris, and London, both the share of total costs borne by stations and per-station costs were unusually high in New York’s newer stations. Recent stations in New York are notable for their large, deep, and highly customized features in contrast to older MTA stations. Stations accounted for 60 percent of construction costs for the Second Avenue Subway, 32 percent for East Side Access, and 62 percent for the 7 Line Extension.246 Stations accounted for only 36 percent of total construction costs for Paris’ Line 14 extension despite large intermodal connections required to connect with the existing system, and 27 percent for Los Angeles’ Purple Line extension. Per-station costs for the Second Avenue Subway were $507 million compared to $161 million for the Purple Line in Los Angeles and $200 million for the extension of Paris’ Metro Line 14.247
TABLE 7: STATION COST COMPARISON AMONG NEW YORK, LONDON, LOS ANGELES, TORONTO, AND MADRID248
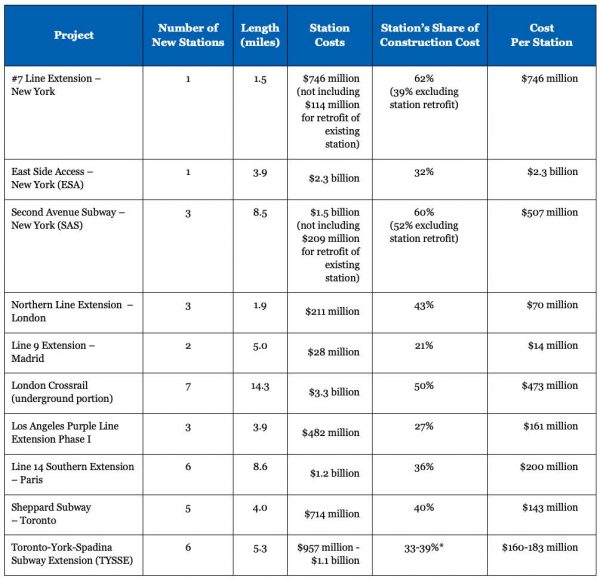
Stations for the recent New York projects are significantly deeper than those on other subway lines. The Hudson Yards station for the 7 Line Extension is 125 feet below ground while the SAS and ESA stations are nearly 100 feet below ground, compared to roughly 50 feet for LA’s Purple Line and Paris Metro’s Line 14 extension. In the case of the SAS, the decision to build deep stations was intended to avoid the expense of relocating utility lines, though any savings were likely negated by the significant cost of these stations. In the case of the 7 Line extension, the 100 foot station depth was necessary due to the line’s tail-end tracks, which extend beyond the terminal below the existing rail yard, and other deep infrastructure. For the ESA project, the new 100 foot-deep terminal below Grand Central Station was chosen over proposals to bring rail service to the station’s existing lower level in part due to concerns associated with excavating the tunnels connecting the station to buildings along Park Avenue.249
A similar relationship between station depth and cost was identified in Toronto, though overall construction costs in Toronto are on par with similar projects in Paris and Los Angeles referenced above. The most recent subway project in Toronto—the 5.3 mile Toronto-York-Spadina Subway Extension (TYSSE)—was among the most expensive in recent history at $579 million per mile ($3.1 billion). TYSSE stations are among Toronto’s deepest, ranging from 65 to 82 feet below ground, and feature long-escalators, expansive column-less interiors when possible, and high ceilings. The TYSSE project’s six stations are estimated to have cost between $957 million to $1.1 billion (roughly $160-183 million per station), nearly 39 percent of the total project cost.250
The second most recent subway project in Toronto was the Sheppard Subway (Line 4), a five-station line spanning four miles. Completed in 2002, the project cost $400 million per mile ($1.5 billion total). Stations on Line 4 are 50 to 59 feet below ground, which makes them shallower than the TYSSE stations yet up to twice as deep as older stations on the Toronto subway. The Line 4 stations are simpler and less grandiose than the TYSSE stations and cost $143 million each ($714 million total). While the Line 4 stations were less expensive than those on the TYSSE, they were still two to three times more expensive than older, shallower stations. When compared to the shallower stations (no deeper than 46 feet) on older projects (mostly built using cut-and-cover methods), the TYSSE stations ranged from 4.2 to more than 18 times more expensive. These trends suggest a linear relationship between greater station depth and construction costs in Toronto. Examples from Madrid and Toronto suggest that cut-and-cover methods may be less costly than tunnel boring, though they may also generate other externalized costs and are far more disruptive at the street-level and can require costly relocation of existing utilities along the trench.251
Station Customization
While some level of customization is necessary for all projects, the extent to which stations rely on standardized designs and simple construction materials can affect project costs. The New York MTA opted for granite archway entrances for the SAS project, which required custom-produced granite cut at the right size and shape. Buy America regulations limited the MTA to a handful of American granite suppliers capable of producing the custom pieces, though the need for custom granite would have likely still resulted in a similarly complicated and expensive procurement. Stations on the East Side Access project were intended to feature pre-cast walls as finishes for portions of the blasted tunnels. The pre-cast pieces, which were sometimes damaged during transport from the project staging site in Long Island, ultimately did not fit together due to the tunnel’s slope and led to workers casting the walls by hand. Researchers noted that leaving the exposed bedrock (like in Stockholm and other European cities) rather than adding finishes likely could have curtailed costs without necessarily sacrificing visual appeal.252
Officials in Madrid and Copenhagen cite standardization and simplification of station design as a cost containment strategy for their respective projects. In Madrid, where subway construction costs are among the lowest in the world (ranging from $134-168 million per mile), stations were kept shallow (55 feet) and primarily built using cut-and-cover methods.253 The most recent extension of the Madrid Metro—Line 9—featured two new stations that cost an average of $14 million each (21 percent of total project costs), far less expensive than other European and American projects.254 In addition to cut-and-cover construction and shallow depth, officials stressed the use of standard, uniform designs, wide platforms, and simple materials as key elements to keeping station costs low.255
Similar efforts to streamline and simplify station design have been implemented in Copenhagen and Los Angeles. Using a modular “kit-of-parts” approach, officials in Copenhagen and Los Angeles standardized sizes, materials, and components for their stations to minimize costs and streamline construction (see Copenhagen Case Study). In 2018, LA Metro adopted a formal Systemwide Station Design Standards policy that established common materials and parts for all future bus rapid transit (BRT) and rail stations. The policy was initially developed in 2012 in response to risi ng construction and maintenance costs associated with unique station designs, including challenges in maintaining or replacing custom station features that negatively affect station appearance over time.256 The standards were produced as a kit-of-parts and specify both the materials and individual components to be used across all stations. These components are primarily made of glass, stainless steel, and concrete, with factory-finished surfaces used in limited cases. Components include glass panels for canopies and entryways; a standardized concrete paving pattern for all station plazas; stainless steel finishes for entrances, gates, railings, and other equipment; and LED lighting. This standardization is intended to allow for customization and variation in station layout—including the integration of public art into glass panels for entryways—while maintaining durability, consistent appearance, and cost-effective construction and repairs across the system.
While station customization can play a role in construction costs, it is difficult to assess the magnitude of its impact compared to station depth. In Toronto, there was minimal difference in stations as a share of total cost between the TYSSE project (with large, ornate stations) and Line 4 (built using a no-frills, minimal design).257 While the former chief of the Toronto Transit Commission suggested station depth, rather than materials, was the primary determinant of station costs for the Line 4 project, more data is needed to evaluate station cost drivers more precisely. The lack of comprehensive data or studies on station costs makes it difficult to fully isolate the impact of station depth or materials on costs for individual projects. However, cost figures and anecdotal evidence from New York City, when compared to design streamlining efforts in Los Angeles, Copenhagen, and Madrid suggest that station customization, architecture, and depth can all play key roles in driving construction costs.
Technological advances have improved the ability to monitor, control and manage operational and safety performance of transit systems. However, they have significantly added to the complexity of projects, particularly tunneling projects. For example, a transit line project can have thousands of unique communications points that are transmitted and report in some manner to a remote location, such as a control center. These include train tracking, signaling, emergency communications devices, intrusion alarms, gas monitors, failure monitors on myriad types of equipment, ventilation control and monitoring, fire alarms, and CCTV.
While not expensive as stand-alone elements, their installation, integration, and testing can add significant time to rail projects. Many of these subsystems, like fire alarms, must be connected in order to work. Activation of a fire alarm in a station affects operational functions of elevators, escalators, messaging systems, station ventilation and alarm reporting. Each interface must be tested for each alarm, of which an underground station can dozens.
Further, given the long time to complete rail projects, specifications for advanced communication systems are often obsolete by the time they are ready to be installed toward the end of a project. This can result in change orders with schedule impacts if upgrading to a more modern standard. Many of these technological requirements are driven by fire and safety codes that are unique to rail projects, discussed in detail below.
Fire Safety Standards
Rail transit stations, particularly below ground, are also subject to safety regulations. The U.S.-based National Fire Protection Association (NFPA), an independent global trade group, publishes safety and fire codes for a range of facilities, including rail transit systems under NFPA 130 Standard for Fixed Guideway Transit and Passenger Rail Systems.258 NFPA 130 is not federal law, but it has been formally adopted by many jurisdictions and agencies as part of their fire safety codes for rail transit construction. While some countries like Spain, France, Japan, Italy, Germany and Austria have their own fire safety standards for transit, most agencies around the world follow NFPA 130.259
NFPA 130 largely consists of performance-based criteria for ventilation, fire endurance and spread, and evacuation, but also include specific provisions for materials, distances between exits, spacing of stations and cross-passageways, and doors, among others. For example, one part of the code that has direct implications for the scope of subway stations, and thus costs, is riders standing on a platform must be able to evacuate the station within four minutes and reach a safe location within six minutes.260
The code also sets parameters for modeling evacuation scenarios. These evacuation times are based on peak service, with trains one headway behind schedule, resulting in twice the normal passenger load on vehicles and twice as many passengers on a platform.261 Additionally, evacuation scenarios assume that one escalator on each station level is out of service, and that the escalator chosen must be the one that would most negatively impact passenger exit capacity.262 Escalators generally cannot make up more than half of a station’s egress capacity on each level.263 This is intended to ensure that evacuation can be completed even in a worst case scenario.
One of the more significant determinants of station platform size are NFPA 130 requirements on the number and width of stairs, as well as the maximum permissible distance from the most remote points of the platform to the nearest exit.264 As a result, station and platform sizes often comfortably exceed the levels that would be necessary to handle normal passenger flow rates. While intended to ensure space for evacuation, meeting these strict standards can lead to a more comfortable passenger experience.265
Other standards that may impact station costs or elements include provisions for the inclusions of cross-passages to allow for passengers to move between tunnels in case of emergency and, for example, if one tunnel has smoke. According to NFPA 130, if the distance between two stations is greater than 2500 feet, cross passages must be built between the tunnels at 800-foot intervals if there are no intermediate shafts to the surface.266 According to one analysis, cross passages are rare in Europe as well as in Japan.267 This is likely in part due to the relatively close spacing an d travel time between stations that may allow passenger to walk a short distance to evacuate, and reducing the likelihood that a train would get caught in the middle of a tunnel and unable to drive to the next station.268 Constructing cross-passages can require additional excavation and complexity that may affect construction costs.
Ventilation systems that can bring fresh air to underground passengers during a safety incident is also a major element of underground metro systems. NFPA 130 requires mechanical and passive ventilation systems to become fully operational within 180 seconds, and maintain airflow rates for at least one hour to allow for evacuation of vehicles.269 Design of ventilation systems also accommodate the maximum number of trains possible between ventilation shafts during an emergency.270
Seismic Standards
Transit systems in earthquake prone areas also must comply with seismic safety guidelines. At and above ground systems are particularly vulnerable to ground movement from earthquakes while underground transit systems largely move with soil in the event of an earthquake and are generally safer.271
Seismic codes for transit are largely handled at the local or a gency level, though there are certain statewide and federal guidelines that agencies may incorporate into their design standards.272 For example, Seattle’s Sound Transit adopted agency-wide seismic standards that take a hazard-based approach to earthquake resilience. These approaches include planning for an Operating Design Earthquake (ODE) this strength over a facility’s 100 year design life. The other is a Maximum Design Earthquake (MDE), which would be expected to occur once every 2500 ye ars, with a 4 percent chance of an earthquake exceeding this level during a facility’s design life. Sound Transit’s guidelines require light rail facilities to withstand ODE’s and resume operations in a “reasonable amount of time,” and withstand a MDE without collapsing or risking lives.273
Meeting such standards can vary depending on the seismic profile of varying regions. For example, San Francisco’s Bay Area Rapid Transit (BART) strengthened its standards over the past decades and are undertaking vulnerability analyses and retrofitting key facilities to enhance their earthquake resilience. These measures include enlarging tunnels that cross through faults to account for potential displacement and incorporating concrete-encased steel ribs.274 Aerial structures are reinforced with stronger foundations or columns to withstand collapse or poor soil is replaced with non-liquifiable soil to prevent collapse or damage.275
Accessibility Standards
Transit stations are also subject to accessibility requirements under the Americans with Disabilities Act of 1990 (ADA). Design specifications for accessibility are outlined under Title II and III of the ADA, also known as ADA Accessibility Guidelines. Enforced by both the federal departments of Justice and Transportation, these guidelines cover vehicles, buildings, transportation facilities, and many other types of facilities. The U.S. Access Board, a federal government agency, writes all code/guidance and has issued supplements to cover different facilities. The ADA guidelines were last updated in 2004 to address usability and format issues, as well as cover new types of facilities. The U.S. DOT formally adopted these new standards in 2006.
Among the DOT-specific guidelines for transit include locating accessible routes in the same area as general circulation paths, including detectable warnings on curb ramps and along platforms that do not have screen doors or platform guards, minimum platform heights, and maximum rail platform slopes.276 DOT has added to these standards over time. For example, in September 2011, DOT added a provision mandating that individuals with disabilities, including wheelchair users, “must have access to all accessible cars available to passengers without disabilities in each train using the station”, to prevent segregating disabled riders in separate vehicles.277 These standards apply to all new construction, as well as alterations to existing facilities.
The ADA requires that any alterations to existing facilities make them fully ADA compliant, or to the maximum extent feasible in cases where full accessibility is not possible. If making a facility fully accessible would exceed 20 percent of the alteration cost, agencies are only required to incorporate accessibility elements that would not result in a disproportionate cost (under 20 percent).278
A U.S. DOT 2016 ruling clarified that any alterations to existing transportation facilities that can impact their usability must incorporate accessibility, including for wheelchair users.279 The ruling also clarifies that the ADA requirement to incorporate accessibility to the maximum extent possible is primarily intended for rare cases where it is impossible to make an existing facility fully ADA compliant. In these cases, agencies cannot cite disproportionate cost as a limiting factor preventing incorporation of accessibility. The disproportional cost provision applies only in instances where a primary function area of a station (such as a platform) is being renovated.
Coverage of the impact of ADA compliance on construction costs has largely revolved around elevator retrofits on older subway systems. The cost of retrofitting elevators has gained particular attention in New York City. Only 23 percent of New York MTA’s subway stations are accessible, and the agency has retrofitted several stations without installing elevators or ramps.280 A 2019 lawsuit ruled that the agency violated the ADA by not installing elevators as part of a 2013 subway station renovation in the Bronx, and must make stations accessible when renovating future stations.281 The agency announced a $5.5 billion capital program in 2019 to install elevators in 70 stations in five years.282 The plan received increased scrutiny for its cost—nearly $78 million per elevator, in contrast to examples from European cities, where station upgrade costs per elevator are as low as $22 million.283 These costs are also lower in other North American cities like Boston, where the MBTA installed three new elevators and two escalators at a Red Line station for $36 million, and Chicago, where a new station with four elevators cost $75 million ($19 million per elevator).284
Accessibility regulations abroad are largely handled at the country level, but generally all stations built in recent decades are designed to be accessible. Transportation systems in Canada are governed by the newly enacted Accessible Transportation for Persons with Disabilities Regulations (ATPDR), as well as the 2018 Accessible Canada Act, which is the first nationwide accessibility act.285 Provinces also have their own accessibility regulations that apply to public entities, like the Accessibility for Ontarians with Disabilities Act.286 Public transportation in Australia is similarly governed by the national Disability Discrimination Act of 1992, which includes design and service standards for public transport similar to the ADA.287
There are no European Union-wide accessibility standards comparable to the ADA, but rather individual member state regulations. The European Accessibility Act, passed by the European Parliament in 2019, largely focuses on fare payment systems and does not explicitly address system design.288 Accessibility on European transit systems can vary significantly. In Barcelona, 143 out of 158 metro stations (81 percent) are accessible, while just under 20 percent of stations on the London Underground are accessible.289 Just three percent of stations on the Paris Metro, for example, are accessible to passengers with disabilities, while the much newer tram system is fully accessible.290 While France passed a law in 2005 to improve accessibility in public spaces, Paris’ Metro was exempt, and its operator has argued that the system’s age would make retrofitting stations extremely costly.
Design and architecture can be significant cost drivers for transit projects in three ways: poor management of the design processes, project design itself, and design standards. Lack of oversight of the design process can result in accepting inadequate or faulty designs that result in issues during construction and require change orders. The design of transit projects themselves, particularly on underground stations, can also raise construction costs. Deep, extravagant stations and the use of bespoke materials have been cited as major cost drivers in cities like New York and Toronto. Lastly, select safety standards can require more complex system design to make a project resistant to natural disasters like earthquakes. Stringent evacuation standards in fire safety codes like NFPA 130 can also result in large subway s tations, while the need to install cross-passages and ventilation systems can be an additional source of costs. Accessibility standards, on the other hand, do not appear to be a particularly significant cost driver for new construction, though accessibility retrofits of older station in New York City have received scrutiny for th e high costs of elevator installations compared to other cities.
4.11 Labor
Frontline labor is a major cost of any capital project. Workers are needed to prepare and install the materials to ensure a safe and long-lasting infrastructure system. But while labor is a major part of overall construction costs, outside of New York City there is little research comparing transit construction labor costs in the United States to places abroad or whether labor is a major cost driver that can be addressed through responsible changes in public policy. The wages, benefits, and work rules that are negotiated for unionized labor, which makes up the majority of the transit capital workforce, are typically embedded in construction contracts protected by nondisclosure agreements and are notoriously difficult to obtain.291
REGIONAL CASE STUDIES
The case studies in this report examine the facts and background of a project or several projects conducted in a region and examined their approach to governance, processes, and project standards. The research relies on discussions with public and private experts and stakeholders in each region to help identify best practices and problems in delivering projects. The case studies were selected in consultation with the project’s advisory panel, and included considerations of project complexity, geographic diversity, modal comparability, and other factors that can help identify cost and timeline drivers along with solutions to improve them.
The following cases are included in this section:
- Los Angeles
- Seattle
- Denver
- Minneapolis-St. Paul
- Copenhagen
- Madrid
- Paris
- Toronto
- Virginia’s I-495 HOT Lanes and the Silver Line
THE ROLE OF THE FEDERAL TRANSIT ADMINISTRATION IN PROJECT DELIVERY
The Federal Transit Administration (FTA) is a modal agency under the U.S. Department of Transportation (USDOT) and administers roughly $12 billion annually through its various grant programs. Fixed guideway (rail and bus rapid transit) projects receive approximately $2.3 billion through the agency’s Capital Improvement Grants (CIG).
The agency employs 550 full time staff across its Washington, DC headquarters and 10 regional offices. Each regional office includes an Office of Planning and Program Development, as well as an Office of Program Management and Oversight. Some of the larger regional offices with more transit activity like Philadelphia (Region 3) and San Francisco (Region 9) have an Office of Financial Management and Program Oversight that provides additional oversight and assistance. Staff sizes at the regional offices ranges from 15 to 40 employees.
Nearly all large transit infrastructure projects use federal resources as part of their funding package, necessitating interaction with FTA staff and complying with federal regulations. This is done primarily through FTA’s regional offices in the early stages of project development. FTA’s in-house staff is supported by project management oversight contractors (PMOCs) that are drawn from a nationwide network of private firms, selected by the FTA through a rigorous review, to provide oversight of major capital projects from conception to operation. These contractors focus specifically on project costs, schedules, expenditures, scope, risk, and safety.317 Transit agencies work closely with FTA staff to secure CIG funding and reach a record of decision on the federal environmental review. The FTA also conducts triennial reviews of grantee agencies, including their procurement practices, capital programs, financials, and compliance with Buy America, civil rights, and other requirements that come with Federal funding. Once funding and NEPA approval are secured, the FTA’s role in construction and operations diminishes.
Local agency staff mostly recall positive experiences working with FTA and benefit from their technical expertise. In particular, oversight and reviews by the FTA before the preliminary engineering phase help agencies better identify and resolve staff capacity constraints, third party and intergovernmental approvals and coordination, or other complications like utility relocations in advance, preventing potential delays. Some cited a lack of staff capacity at the FTA regional offices and distances between agencies offices and FTA offices resulting in slower decisions and inability to provide greater technical assistance.
AMERICAN CASE STUDIES


THE ROLE OF THE EUROPEAN UNION IN PROJECT DELIVERY
Public transportation projects in Europe are largely planned, funded, and delivered at the national and local levels. However, the European Union plays a limited role in funding and overseeing select projects, as well as setting guidelines for environmental assessments. This funding and oversight role is handled by the European Commission, the EU’s executive branch. The Commission is organized into multiple departments and executive agencies according to policy area.407 The Directorate General for Regional and Urban Policy oversees the segment of the EU budget that funds urban transportation projects, and consults with other DGs, including the DG of Mobility and Transport.408
The EU sets some high-level transportation policies aimed at meeting specific goals like decarbonization, adoption of new technology, and reducing disparities in economic development between member states.409 Among the more specific goals of the EU is the completion of the Trans-European Transport Network (TEN-T).410 The EU provides funding and financing assistance to member states for TEN-T projects which are primarily cross-border rail and road projects. There are, however, some public transit projects that receive funding under this program. For example, Metro line 8 in Madrid, which provides a connection from the city center to the Madrid Airport, which is deemed an international connecting point for the TEN-T network. As a result, the European Union covered 76 percent of the project cost through its Cohesion Fund.411
The EU also sets general standards for formatting, processes, and environmental impacts to be considered through its Environmental Impact Analysis (EIA) directive (Directive 2014/52/EU).412 The EIA directive details the selection criteria that should be used to determine whether or not to prepare an environmental impact statement, including project characteristics, location, and the anticipated extent of potential impacts. The directive also requires public notices and consultation opportunities during various stages of the project development and environmental assessment phase.
While this directive specifies the general structure, form, and content of environmental impact statements, each member state is responsible for adopting its own law and process. The most recent amendment of this directive in 2014 instructed member states to streamline environmental reviews, enact time limits on the environmental assessment process, and simplify language to make EIA reports more accessible to the public.413
INTERNATIONAL CASE STUDIES


THE ROLE OF THE FEDERAL HIGHWAY ADMINISTRATION IN PROJECT DELIVERY
The Federal Highway Administration (FHWA) provides assistance and funding for states to design, build, operate, and maintain the national highway system (Federal-aid Highway Program).577 The agency is headquartered in Washington, D.C. and has a division office in every state, the District of Columbia, and Puerto Rico, employing roughly 2700 staff in total.578 Division offices are often located in state capitals, where most state DOTs are also headquartered.
The total federal-aid highway budget is $41 billion per year and is largely distributed to state DOTs under existing formulas in federal law. Unlike transit CIG grants, most FHWA grants for large projects are not discretionary and state DOTs are responsible for selecting and evaluating projects that will receive federal funding.579 To be eligible, projects must be included in a state’s Statewide Transportation Improvement Program (STIP) and the MPO’s Transportation Improvement Program (TIP or RTIP), which lists the major transportation projects across all modes that are expected to need federal funding or approval.580
FHWA uses a risk-based methodology to determine which projects to dedicate additional oversight and technical assistance, including size, cost, schedule, and complexity.581 For these major projects, division offices develop a project-specific plan that documents the justification for and scope of the division office’s involvement. The division office will often embed its own staff into a project to provide technical assistance across multiple project phases. FHWA division offices are able to lend in-house expertise on ROW acquisition, environmental reviews, engineering, operations, freight, and finance. The co-location of state DOTs and FHWA division offices in the same city allows for regular meetings, knowledge-sharing, and cooperation between state and federal teams.
Under federal law, the Surface Transportation Project Delivery Program also allows states to assume NEPA review and approval authority (known as NEPA assignment).582 This eliminates the need for FHWA review and approval on specific projects, and help streamline the environmental review process. States may apply for NEPA assignment and, if approved, are bound by a memorandum of understanding with FHWA that must be renewed every five years. Seven states currently have NEPA assignment agreements with FHWA: Alaska, Arizona, California, Florida, Ohio, Texas, and Utah.
MULTIMODAL CASE STUDY

TAKEAWAYS AND RECOMMENDATIONS
The preceding data, analysis, and case studies reveal major challenges with public transit cost and project delivery in the United States, outlined below. Especially at a time of economic and fiscal uncertainty as well as environmental and social anxiety, it is critically important we get the most out of our existing public investments and that those projects we do undertake are successful both during the planning, design, construction, and implementation phases.
However, this work also makes it clear that there is no silver bullet to cutting the costs and timelines of critical transit projects. It also finds that the responsibility for doing so does not rest solely on federal reforms, fixes at the agency level, or with private sector practice. Rather, the challenges are acute, complex, and multi-faceted and therefore the solutions are too. The recommendations below are based on that fundamental premise. They are organized around the governance/process/standards themes discussed in Section 2 and, similarly, there is overlap among the recommendations as well as their intended targets.
6.1 We need to get the institutions, oversight, and decision-making right. Governance does not usually garner the most attention, but it is paramount to the success of a project both at public agencies as well as with the private sector.
6.2 Some of the processes, procedures, and practices that public and private actors must undertake in order to build transit projects—from conception to final completion—are often too slow, cumbersome, or outdated. We need to make it easier to build more and better transit projects.
6.3 Building more and better transit demands a new framework for how we think about projects, the standards that are applied, and the policy environment in which they operate.
CONCLUSIONS
Our thorough review of project delivery reveals that inadequate governance, cumbersome processes, and outdated standards cost U.S. transit project dearly. While there is no single cause for high costs and long timelines, the compounding effects of these underlying issues creates an environment of inefficiency that results in fewer projects being built, shorter transit lines, and sub-optimal routing decisions that leave many systems underutilized. Implementing the changes necessary to tackle this problem will require a concerted effort at the federal, state, and local levels.
A common thread across the recommendations in this report is the lack of underlying political will to implement best practices. The United States suffers from a political climate that does not uniformly see investment in transit infrastructure as net positive. Instead, transit project sponsors spend much of their public outreach effort simply justifying their existence and the value of transit, rather than engaging on the details of a project. Public skepticism of transit investments results in broad community pushback, increased willingness to sue to delay or block projects, and more judges that are sympathetic to those lawsuits. The lack of broad public acceptance for transit also results in communities demanding mitigation for negative construction impacts rather than demanding faster timelines.
This stands in stark contrast to peer countries, where support for transit is much greater and often cuts across partisan lines. The successful subway expansion in Madrid was a product of socialist and conservative parties out promising each other on how much transit could be built in the region. The conversative party won regional elections on their promise to build more subway lines and were reelected due to their ability to meet their goals. While there are always detractors, broad support for transit allows communities to clamor and compete for projects, rather than trying to block them.
Changing the national mindset on transit investment is a monumental task and one that will take significant effort. Luckily, there are several important opportunities to help change the narrative on transit investments. Increasing environmental consciousness and a global need to cut greenhouse gas emissions are already expanding political support for transit investments, as is the growing focus on combatting racial and socioeconomic inequality. But most importantly, as more localities use their own funds to expand and invest in their transit networks, there will be a strong financial incentive for regions to change their approach to project delivery. By implementing best practices and making the changes necessary to effectively deliver major projects, project sponsors will be able to deliver more and better transit projects to the communities that need them.
ACKNOWLEDGMENTS
Eno would like to express gratitude to Alice Grossman, Jeff Davis, and Katherine Idziorek for their research assistance, as well as Katie Donahue and Caroline Marete for their help reviewing and editing this report. Karen Price and Madeline Gorman also provided invaluable assistance preparing this report and accompanying digital materials for publication.
The Eno Center for Transportation would like to thank the following individuals for contributing their expertise, constructive feedback, and support as members of the advisory panel convened for this research initiative:
Adjo Amekudzi-Kennedy
Professor and Associate Chair, Global Engineering Leadership and Entrepreneurship, School of Civil & Environmental Engineering, Georgia Institute of Technology
Rabinder Bains
Chief Economist, Federal Transit Administration
Andrew Bata
Regional Manager, North America UITP
Allison Black
Senior Vice President & Chief Economist, American Road & Transportation Builders Association
David Carol
Chief Operating Officer, American Public Transportation Association
Aileen Carrigan
Principal & Founder, Bespoke Transit Solutions
Richard Clarke
Former Chief Program Management Officer,
Los Angeles County Metropolitan Transportation
Nuria Fernandez
Administrator, Federal Transit Administration
Eric Goldwyn
Research Scholar, New York University’s Marron Institute on Cities and the Urban Environment
Tracy Gordon
Senior Fellow, Urban-Brookings Tax Policy Center
Hani Mahmassani
Director, Northwestern University Transportation Center
Beth Osborne
Director, Transportation for America
Stephanie Pollack
former Secretary and CEO, Massachusetts Department of Transportation
Thomas Prendergast
Americas Transit Leader, AECOM
Edwina Smallwood
Economist, Federal Transit Administration
Christof Spieler
Senior Lecturer, Rice University
Raj Srinath
Former Deputy General Manager/Chief Financial Officer, Santa Clara Valley Transportation Authority
Ali Touran
Professor of Civil and Environmental Engineering, Northeastern University College of Engineering
Mia Veltri
Program Analyst, Federal Transit Administration
Carole Voulgaris
Assistant Professor of Urban Planning, Harvard Graduate School of Design
Charlie Zelle
Chairman, Metropolitan Council

The Eno Center for Transportation also wishes to thank the Merck Family Fund, TransitCenter, the Barr Foundation, the Rockefeller Brothers Fund, and the John
Merck Fund for their generous support of this initiative. The Federal Transit Administration also provided financial support for this and future related work on transit costs and project delivery.