1.0 INTRODUCTION
When the Infrastructure Investment and Jobs Act (IIJA) was signed into law at the end of 2021, it promised to usher in a new era in transportation, energy, water, and telecommunications projects. This major increase in investment provides public transportation programs with $90 billion in guaranteed funding over five years, a 65 percent increase over previous funding levels. In early April 2022, the first tranche of money started going out to agencies across the country.
Today, there is a particular emphasis on making sure that money for new public transit projects is spent more effectively, and that projects are delivered on time and on budget. Unfortunately, recent Eno research found that urban rail transit projects in the United States suffer from disproportionately high costs and long timelines compared to international peers. The United States pays more than a 50 percent premium to build at-grade and tunneled rail projects despite its projects being relatively simpler in terms of engineering aspects. For instance, projects here often run along the surface and through existing rights-of-way, and with greater distances between stations compared to international projects.
Assessing how other countries govern, plan, build, and finance their rail transit projects will lead to a better understanding of how to improve delivery in the United States. Trade missions, capacity building, and technology transfer initiatives with agencies abroad are critical to learn what works, what does not, and how lessons can be tailored for other cities and metropolitan areas. Such information exchanges would help U.S. planners, engineers, leaders, and designers better understand the best practices and innovations in governance, planning, standards, and processes of transit project delivery around the world.
This study builds on Eno’s 2021 Report Saving Time and Making Cents, and the ongoing initiative to improve transit rail project delivery in the United States. Eno selected 10 countries in which to conduct detailed reviews, summarized below and in more detail in accompanying case studies. For each country, we collected comprehensive data on recent rail projects (excluding land acquisition, support facilities, and rolling stock when possible) and added them to our construction cost database. This enabled us to make quantifiable comparisons on metrics such as number of stations, cost per mile, length, and percent tunneled. The full database can be accessed at here.
This analysis found there are clear lessons the United States can learn from its peer nations with respect to transit project delivery. More important than the precise governance structure, delivery method, or process employed is the shared commitment at all levels of government to delivering high-quality transit. There needs to be strong public-sector staff capacity and management skills, close collaboration between stakeholders, and the ability for project sponsors to make prompt, firm decisions about projects. No country is inherently predisposed to having higher or lower construction costs, but those that do it best are those places where strong project governance, straightforward processes, and modern standards are aligned. Uncertainty, ambiguity, and lack of coordination are the enemies of efficient transit project delivery.
2.0 BACKGROUND AND METHODS
To gain a better understanding of government, governance, funding structures, and other policies that support project delivery internationally, Eno selected 10 case studies from other democratically governed countries (Figure 1). While countries with one-party political systems or autocratic governments, such as China or Russia, can have success building passenger rail systems, the decision-making structure and regulatory requirements of this type of government are too dissimilar from that of democratic systems, making for many nontransferable lessons for the U.S.
In selecting case study countries, we strove for geographic diversity and included only those that have built at least one major urban rail project since 2000. We conducted dozens of interviews with stakeholders and experts familiar with rail transit project delivery in each place. Interviewees represented national and local government agencies, research institutions, trade associations, and other experts We reviewed government budgets, project planning documents, environmental assessment reports, research publications, industry reports, and popular media articles.
FIGURE 1: CASE STUDY COUNTRIES

Blue are countries reviewed in this study, compared with the United States (green)
The goal was to review how the responsibilities of different levels of government (federal/national, state/provincial, regional, local, agency) in other countries vary in terms of government, project governance, funding, regulation, planning, and project execution. We evaluated four critical areas for each country—governance, regulation, finance, and construction—to establish a common baseline of understanding and comparison.
Eno collected data on 132 rail transit projects completed in the case study countries since 2000. This information includes data on grade alignment, construction timelines, stations, and construction costs. All construction costs were converted into 2021 U.S. dollars using the OECD’s purchasing power parity rates and adjusted for inflation using the Engineering News-Record Construction Cost Index (CCI). These data were added to Eno’s transit construction cost dataset.
Comparing as-built construction costs can offer some clues as to whether other countries are building public transit systems more cost-effectively. However, there are several caveats and challenges when attempting to make a true “apples to apples” comparison between domestic and international construction costs, and between different projects within the same country. The final output of the database is a comparable “unit cost,” in inflation-and currency-adjusted dollars per mile of rail line.
But not all projects and agencies are transparent in their cost reporting, and when they are the data tend to be reported inconsistently. For example, some projects include costs not associated with the actual unit cost of mile of rail line. Elements like maintenance facilities or rolling stock are included in some projects, but not others. Some projects deal with unstable soils, and costs can vary based on the number and length of stations. Detailed cost breakdowns are typically not reported for most projects, and if they are, there may be vast differences in the categories used.
For federally funded projects in the United States, regulations require agencies to report cost breakdowns using nine Standard Cost Categories (SCCs). However, as the Eno team discovered when reviewing select cost breakdowns received through Freedom of Information Act (FOIA) requests, some agencies in the United States also use their own internal methodology to track costs, especially for projects that are locally funded. Rather than reporting project costs for items like stations, sitework, and stations, costs in some cases are broken down by project phase (i.e. preliminary engineering or final design). Cost breakdown methodologies between countries can also vary.
When comparing construction costs, it is important to avoid drawing sweeping conclusions or over-interpreting trends, though such comparisons will become richer with more data.
2.1 Government, governance, and legal structure
In general, democracies are governing systems where citizens are sovereign and control the government. Citizens vote to elect legislative representatives who have constitutional power to make policy decisions. The cases in this report are all considered to be parliamentary or presidential democracies. In a parliamentary democracy, the executive branch of government is a cabinet headed by a prime minister. In a presidential democracy, the executive branch of government is led by a president who heads an executive branch of government that is separate from the legislative branch of government (Table 1).
Such attributes matter for project delivery because the executive branch of the national government distributes funds to transit projects and creates regulations that govern their construction. Consistent policies matter for delivering megaprojects with long timelines. The case study countries range from highly centralized to federated power structures. Centralized countries make most or all of the funding and planning authorizations at the national level, while federated countries delegate much of this power to lower-level units of government.
Countries also differ in the type of legal system they use. Roughly 150 countries around the world use civil law systems, and 80 use common law systems. In countries that practice common law, published judicial opinions often set precedent for succeeding cases. In civil law systems, codified statutes determine judicial outcomes. Table 1 shows the classification of each legal system for the 10 case study countries, which can affect agencies’ ability to manage utility relocation, environmental reviews, and multijurisdictional issues related to delivering a large transit project.

We also examined varying roles of government, including transit-related responsibilities of the national government (e.g. transportation cabinet officials, ministers of other relevant agencies, and, in some cases, research institutions); sub-national governments (i.e. provincial, regional, or local governments); transit agencies (i.e. the primary capital project delivery and/or operating bodies of public transit); and other stakeholders, such as special purpose delivery vehicles and private operators, if applicable.
2.2 Project regulation and planning
Transit projects usually need a range of authorizations and permits to proceed. Those usually require mandated planning processes, environmental review, and safety standards such as fire protection and preparation for seismic events. Such approvals to proceed are often necessary to receive funding and can be set at all different levels of government, depending on the country and its structure.
Project planning consists of all processes that occur prior to construction. It begins when cities or metropolitan areas submit project funding proposals from state, provincial, or national governments. Throughout this process, there is interaction between officials at all levels of government. Similarly, the countries included in this study require some form of an environmental review process to allow project sponsors (i.e. the public institutions charged with leading project delivery) to measure the environmental externalities associated with the project and its construction. At this point, the project sponsor either evaluates one discrete project or a series of alternatives, comparing it with a “no-build” option, and assesses its potential impacts on the environment.
Laws and regulations at all levels of government dictate the processes by which projects are planned and what is possible for project delivery. Throughout both the preliminary planning and environmental review phases, varying degrees of public input are sought to inform the final documentation produced and, ultimately, the nature of the project. The public is typically given adefined period of time to offer comments on the proposed project, and government officials are generally required to respond to those comments or incorporate them into project plans.
2.3 Project funding
Rail transit capital projects are expensive, and funding is derived from a combination of sources.
Most national governments provide grants to project sponsors as part or all their funding package. These grants involve competitive applications, legislative earmarks, infrastructure banks, or other programs and are typically distributed from a national-level transportation agency. Local, state, or provincial governments also provide grants or dedicated taxes for transit projects, especially in federated systems that devolve significant planning authority to local governments. Typically, local contributions comprise a smaller portion of capital funding than national government grants, but in some cases the national government provides little or no financial support for urban transit.
In some systems, passenger fare revenue exceeds operating expenses and provides some of the funding resources needed for capital expansion. Project sponsors can bond against future passenger fares to complete a funding package. This is uncommon but has been used to fund some ofthe system expansions in Chile, South Korea, and South Africa. Also relatively rare is private funding, either through a public-private financing partnership (P3) or other arrangement where a for-profit consortium builds and operates transit under an agreement with a government or agency. In this case, private investors are repaid through passenger fares or promises of government funding if they meet construction or operational requirements.
2.4 Project construction
The work of building a transit project is typically contracted out to private companies that specialize in various aspects of construction. The transit agency (or project sponsor) manages and oversees the project, and also oversees private firms that provide services such as engineering, planning, project management, and design. Construction contractors build the physical infrastructure and project managers who are either public sector employees or hired private consultants are also overseen by the project sponsor.
In some cases, public special purpose delivery vehicles (SPDVs) are created for specific projects to oversee planning and construction. These temporary, self-governed entities are more common outside of the U.S. and are usually public corporations empowered to make decisions about project delivery.
There are several contract types available for organizing the project delivery process, including:
- Design-bid-build (DBB),in which the project sponsor hires an engineering and planning firm to design the project and awards separate contracts to construction companies based on the designer’s plans. The project sponsor owns design details and assumes much of the project’s financial risk.
- Design-build (DB) allows the project sponsor to procure design and construction together in a single contract. The DB entity is typically a consortium of multiple firms that is liable for delivering the planned asset, usually according to a fixed price.
- Construction manager-at-risk(CMR) contracts shift some control and risk to the private sector, though the project sponsor controls and owns project designs. The construction manager is selected prior to the completion of the design, and thus can participate in the design process.
Project construction also involves procurement rules, workforce compensation and unionization, project management structures, and approaches to address community disruption. These factors can vary from project-to-project and country-to-country. For example, many projects cover workforce healthcare and other benefit costs directly either through employer-based plans or government payroll taxes, and other countries do not. Those that are noteworthy or consistent within a country are highlighted in this report.
3.0 ANALYSIS
This analysis found large variation in construction costs across the 10 case study countries. Construction costs for primarily tunneled projects range from under $300 million per mile in South Korea, Chile, Norway, and Italy to over $500 million in Germany and Japan. The United States averages over $1.3 billion per mile if including two short, tunneled projects in New York City, or $582 million per mile on average if they are excluded.

Similarly stark variations in at-grade construction costs were also observed in our 10-country sample. Some countries, like Japan, witnessed higher-than-average construction costs for both at-grade and tunneled projects, while countries like Italy and Norway are characterized by lower-than-average costs across varying grade alignments. One notable exception is Germany, which has the third highest tunneling costs but the lowest at-grade construction costs. This is due in part to German tram projects, which often run through mixed traffic and are relatively simpler to design, permit, and construct.

Despite the wide cost variation for both tunneled and at-grade projects, we found no discernable relationship between a country’s transit construction costs and its system of government, level of centralization in planning and financing, or use of common versus civil law.
For example, in Australia transit planning and decision-making is concentrated at the state level, with far fewer cross-jurisdictional issues than the United States. Yet despite this structure, Australia’s at-grade construction costs were among the highest in our database. This is largely due to the recent extension of Sydney’s heavy rail system, which experienced several cost overruns and was the costliest at-grade project among the case study projects at $325 million per mile. Our case study found that high costs on this project were due to underbidding by contractors, inaccurate risk assessment, and complex interfaces between the line and several brownfield sites.
Similarly, transit planning, governance, and decision-making in both Chile and Japan is highly centralized, yet those countries fall on opposite ends of the cost spectrum. While decision-making is strong and centralized at the national level, Chile’s extraordinarily low construction costs are mostly due to favorable soil conditions, strong staff capacity and expertise, and minimal pushback against projects.
Conversely, Japan is home to four of the five most expensive tunneled projects we examined (outside of the U.S.) despite similar expertise and concentration of decision-making and planning at the national level. At nearly $1.3 billion per mile, the 2.5-mile Minatomirai Line in Yokohama is the most expensive tunneled project outside of the United States in our database. This high cost may partially result from complex site conditions along the route, including building through reclaimed land in the city center. Other tunneled projects in Japan have involved complex capacity expansion projects along existing transit routes, in addition to new lines. The country’s focus on high operational standards may necessitate more costly design. These variations suggest that certain governmental structures or legal requirements do not inherently predispose a place to have higher or lower costs. Rather, countries can achieve success in project delivery by implementing best practices. Norway, for example, does not have a strong pipeline of tunneling projects like Chile and has less in-house expertise. However, it benefits from a tradition of strong public sector management and uses cost-efficient designs.
Also unclear is what explains the United States’ significant and growing cost and timeline premium. Like previous Eno research and analysis of transit construction costs, our comparison of construction costs within this 10-country sample found the United States pays more on a per-mile basis to build transit than most peer countries abroad, and much higher than in places like Norway, Chile, and Italy.
When comparing U.S. construction costs with all projects in our database, the United States pays 48 percent more on a per-mile basis to build primarily at-grade transit projects, and 57 percent more for below-ground lines. This cost premium holds for both tunneled and at-grade projects. When including the disproportionately expensive tunneled projects recently completed in New York City, the U.S. tunneling premium rises to 263 percent. Additionally, at-grade projects in the United States take, on average, three months longer to construct, while below-ground projects take more than nine months longer than similar projects abroad.

One caveat in comparing tunneling costs is that there have been relatively few tunneled lines completed in the United States since 2000. The tunneled lines in Table 5are currently under construction and are therefore not included in our database, but all are expected to cost more than most peer projects abroad. Including these projects would further increase the U.S. tunneling premium.

In addition to project costs, Eno’s database includes information on project construction timelines, measured as months between groundbreaking and opening of the project. This metric only covers the time to construct a line, and not the other pre-construction aspects that this and previous Eno research has identified as important cost and timeline drivers. For example, preparatory sitework, the environmental review process, land acquisition, stakeholder engagement, and lengthy planning periods, are not captured in these timelines. Projects may be proposed in one form or another, but not formally become reality until years or decades later. It is thus difficult to pinpoint a precise and consistent “start” date for transit lines. While the construction timeline metric does not capture the full timeline of a project, this and previous Eno research shows there is a direct relationship between the time it takes to construct a transit line and its final construction cost across both U.S. and international projects.
For projects in the ten case study countries, the United States constructs projects in an average of 54.3 months, while the average construction time for the other countries is 68.4 months. But as shown in previous Eno research, this can be attributed to the United States building mostly at-grade projects, while peer countries build many more tunneled lines, which take longer on average.
When it comes to building tunneled lines, the United States takes on average 89.6 months, compared to 81.1months in the ten-country sample, as shown in Figure 2. This table shows the construction period (in number of months) for three types of projects: those with 20 percent or less tunneling, projects with between 20 percent and 80 percent tunneling, and those with 80 percent or more tunneling.
FIGURE 2: TIME TO COMPLETE (IN MONTHS), U.S. VS. CASE STUDY COUNTRY PROJECTS
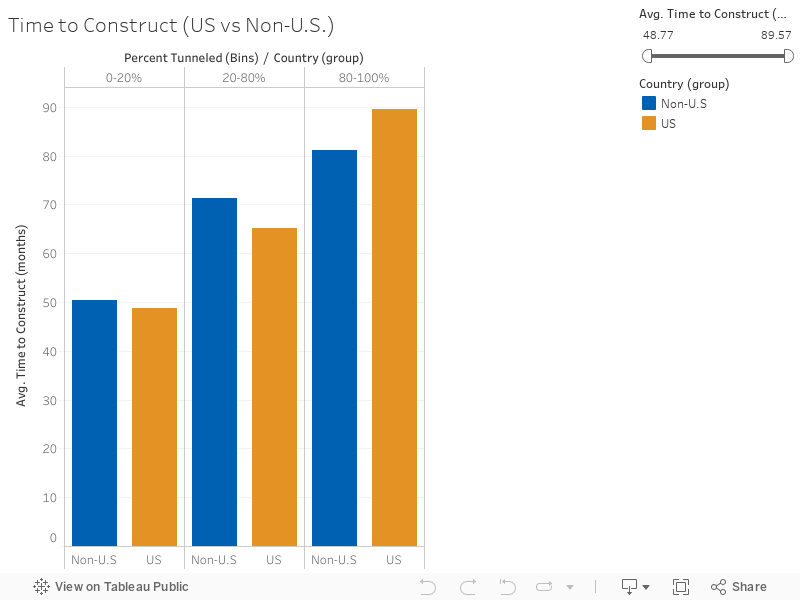
Note: This graphic excludes projects that took more than 150 months to construct. Additionally, only four U.S. projects are tunneled between 20 and 80 percent, which limits the takeaways of that portion of the data. Several projects from Mexico were excluded due to an inability to find precise groundbreaking data.
Construction timelines in the United States average slightly better than the international for projects with less than 20 percent tunneled. However, compared to some of the lowest cost countries the United States still takes longer. For example, at grade projects in Australia, Germany, and Chile average 25.1, 26.7 and 42 months, respectively.
4.0 RECOMMENDATIONS
This scan of quantitative and qualitative information about rail transit construction costs around the world reveals important considerations for policy makers in the United States. These recommendations can be grouped into three broad categories:
Governance
The public authorities that oversee transit project funding and construction in our federalist system. Includes how they function, the way they make decisions, and how they work with other public authorities and with the private sector.
Standards
The federal, state, and local rules and regulations that must be adhered to in order to achieve an overall policy goal directly or indirectly related to the project.
Processes
The procedures and practices that public and private staff undertake to build transit projects from conception to final completion. Includes the steps that must be followed, timelines, and tasks to be completed.
4.1 Government structure is not an indicator of project costs or timelines, but leaders and project sponsors must recognize that governance is important.
4.2 Other countries face similar challenges with processes needed to build high-quality projects, and the United States should learn from their experiences managing them.
4.3 The standards to which projects are held affect project delivery and final outcomes. Project sponsors in the United States should seek to develop high-quality projects informed by best international practices.
CONCLUSION
The United States pays more for rail transit on a per mile basis than the average of ten peer nations reviewed in this study due to many compounding factors. These include issues with inadequate project governance, inefficient processes, and lack of standardization, as detailed above. Meanwhile, across the ten countries evaluated for this research, all of them share in common a democratic government structure but vary considerably in terms of the actual governance, processes, and standards to which projects are held. Likewise, rail transit projects delivered in these countries fall on a spectrum of costs and delivery times, but these outcomes are not tied to any particular factor.
Our study found successful project delivery in countries with strong public institutions with the capacity to manage megaprojects, smart approaches to contracting, coordination of complicated processes, and standardization of redundant project components. Insights from this data analysis and research interviews also underscore the importance of strong public sector staff capacity and management skills, close collaboration between stakeholders, and the ability for planners to make prompt, firm decisions about projects.
These insights highlight our previous recommendation that project sponsors need to look beyond the United States to internalize best practices in governance, decision-making, and project delivery. More research is needed on how to infuse those best practices into the governance, processes, and standards of American public agencies, and will be the subject of forthcoming initiatives from this research program
ACKNOWLEDGMENTS
The Eno Center for Transportation would like to express gratitude to Brianne Eby, Romic Aevaz, and Katie Donahue for their research and writing contributions to this paper and to Philip Plotch, Robert Puentes, and Ethan McLeod for their help with reviewing and editing. Karen Price, Jonathan Hammond,and Michaela Boneva also provided invaluable assistance in preparing the report and accompanying digital materials for publication.
Eno would also like to thank members of our Project Delivery Advisory Panel for their expertise, constructive feedback, and support of this work, including Alison Black, David Carol, Aileen Carrigan, Richard Clarke, Eric Goldwyn, Beth Osborne, Thomas Prendergast, Edwina Smallwood, and Margaretta Veltri.The Eno Center for Transportation would like to acknowledge and thank the Federal Transit Administration for providing financial support for this and future work related to improving transit project delivery in the United States.